Two million CAN frames and the limits of React
CANcorder, my CAN bus logger and analyzer, is built with Tauri 2 and React 19. It is a desktop app for macOS, Windows, and Linux — written in TypeScript on the frontend, Rust on the backend, and held together by Tauri’s IPC bridge. For the first year of development, this stack felt like a gift. Components are quick to write, state management is straightforward, and the iteration speed of hot-reloading a web view inside a native shell is hard to beat.
Then someone opened a 2.4 million frame CAN log from a vehicle test.
What “fast enough” used to mean
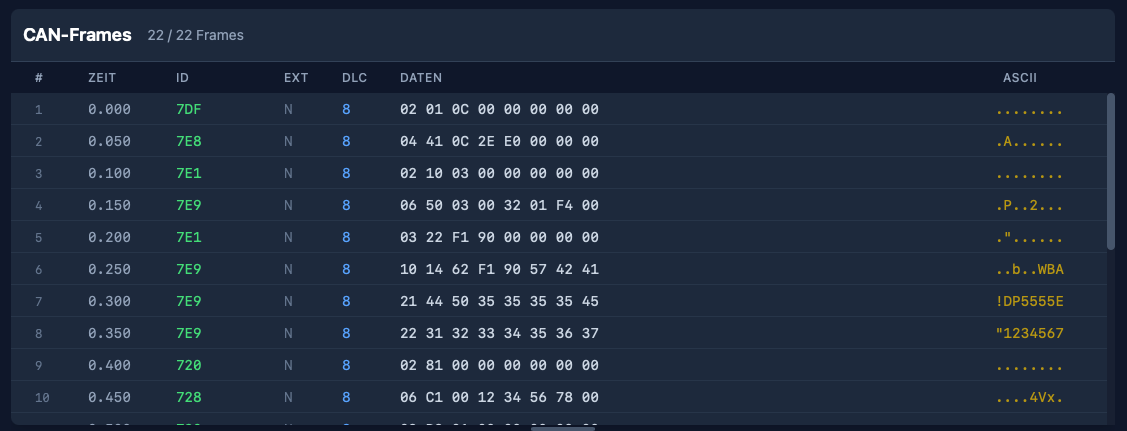
In the early days, the frame table was a straightforward React component. Each visible row was a <div> with child elements for index, timestamp, arbitration ID, DLC, hex data, and ASCII. The ISO-TP (transport message) table was similar, with the additional complexity of expandable protocol hint sections. Both tables used virtual scrolling — the frame table via a hand-rolled implementation, the ISO-TP table via @tanstack/react-virtual — so the browser only ever had to maintain DOM nodes for the rows you could actually see.
For a few thousand frames this was fine. Even for tens of thousands it was workable. But CAN traffic in the real world is not a few thousand frames. A typical bus runs at 500 kbit/s and carries hundreds of frames per second. Record for an hour and you are looking at a million rows. Record a vehicle test session and the number can easily double.
At that scale, the React/DOM approach started to fall apart — not in one dramatic failure, but in a steady accumulation of small costs that added up to big latency.
Death by a thousand DOM nodes
The fundamental problem is not React. React’s reconciliation is actually quite good at what it does. The problem is what lies beneath: the browser’s rendering pipeline.
Every visible row is a subtree of DOM elements. Each element participates in style resolution, layout, paint, and compositing. The virtualizer makes sure only ~30 rows exist at any given time, but scrolling means destroying and creating those subtrees at 60 fps. That means: allocate nodes, attach them to the document, compute styles, run layout, paint layers, composite. Every frame. At every scroll position.
For modest data sets, the browser handles this without breaking a sweat. But when you add row selection highlights, search match indicators, colored arbitration IDs, hex formatting, ASCII previews, and measurement deltas — each with its own element and style — the per-row cost becomes nontrivial. Multiply by the rows that enter and leave the viewport during a single scroll gesture, and you start dropping frames.
The ISO-TP table was worse. It has variable-height rows (expandable hint sections, expandable data previews, status icons), so the virtualizer needed to measure row heights dynamically. That meant even more layout work per scroll event, and the height estimates had to be continuously recalculated as sections were toggled open and closed.
The intermediate steps
Before the big rewrite, I tried the obvious optimizations:
-
Batched frame ingestion. The Rust backend switched from emitting one Tauri event per CAN frame to batching up to 256 frames per event, flushed every 16 ms. The frontend stored incoming frames in refs rather than state, and flushed them to the React render cycle via
requestAnimationFrame. This reduced the number of React re-renders from “one per frame” to “one per animation frame” — a huge win for live capture throughput, but it did not help with scroll performance on large static datasets. -
Memoized row components. Wrapping each row in
React.memoprevented unnecessary re-renders when sibling rows changed. Good practice, but the real cost was not re-rendering existing rows — it was mounting and unmounting rows at the scroll edges. -
Deferred filtering. For large datasets (>50,000 frames), filter computation was split into chunks via
requestAnimationFrameso the UI remained responsive during rebuilds. Again, helpful for filter changes, but orthogonal to scroll performance.
All of these were necessary. None of them were sufficient.
The canvas rewrite
The solution was to stop asking the browser to manage a DOM subtree for every row — and draw the table by hand.
Both FrameTable and IsoTpTable were rewritten from React component trees to imperative Canvas 2D renderers. The React component now owns a single <canvas> element. A FrameTableRenderer class (and its IsoTpTableRenderer counterpart) paints the visible rows directly:
render(scrollTop: number) {
  const ctx = this.ctx;
  ctx.fillStyle = this.colors.get("table-panel-bg") || "#0f172a";
  ctx.fillRect(0, 0, this.width, this.height);

  const startIndex = Math.floor(scrollTop / ROW_HEIGHT);
  const endIndex = Math.min(
    totalRowCount,
    Math.ceil((scrollTop + this.height) / ROW_HEIGHT) + 1
  );

  for (let i = startIndex; i < endIndex; i++) {
    // draw row background, indicator, index, timestamp,
    // arbitration ID, type, DLC, hex data, ASCII — all via
    // fillRect and fillText, no DOM involved
  }
}
No DOM nodes. No style resolution. No layout engine. No compositing layers per row. Just fillRect and fillText, driven by a scroll offset.
The renderer reads CSS custom properties once (via getComputedStyle) to pick up the theme colors, then paints at native speed. The <canvas> is scaled by devicePixelRatio for crisp text on Retina displays. And because there is only one DOM element — the canvas itself — the browser’s per-frame work is trivially small: composite one layer, done.
Scroll compression
There is a subtle problem that only appears at extreme scale. Browsers impose a maximum scrollable height. In practice it is on the order of tens of millions of pixels, so at 32 pixels per row you can hit it a little past the million-row mark. Past that point, scrollTop values get clamped, and the bottom of the dataset becomes unreachable.
The fix is a scroll compression function:
const MAX_NATIVE_SCROLL_HEIGHT = 33_000_000;
const COMPRESSED_SCROLL_HEIGHT = 250_000;

function createScrollCompression(totalHeight: number, viewportHeight: number) {
  if (totalHeight <= MAX_NATIVE_SCROLL_HEIGHT) {
    return { enabled: false, /* identity mapping */ };
  }

  const scrollContentHeight = Math.max(viewportHeight, COMPRESSED_SCROLL_HEIGHT);
  return {
    enabled: true,
    scrollContentHeight,
    actualToVirtual: (scrollTop) =>
      (scrollTop / (scrollContentHeight - viewportHeight))
        * (totalHeight - viewportHeight),
    virtualToActual: (scrollTop) =>
      (scrollTop / (totalHeight - viewportHeight))
        * (scrollContentHeight - viewportHeight),
  };
}
The invisible scroll content element is clamped to 250,000 pixels. The actual scroll position is mapped linearly to the virtual row space. The user scrolls through a quarter-million-pixel-tall region while the renderer translates that into two-million-row space. In practice this keeps navigation seamless and the scrollbar position meaningful, even though the native thumb size now reflects the compressed range rather than the full virtual height.
Getting work off the main thread
Canvas rendering removed the paint bottleneck, but there were still moments of jank: opening a large file and watching the UI freeze while ECU detection scanned millions of frames.
The ECU detection — counting unique arbitration IDs and their frequencies — was moved to a dedicated Web Worker. The main thread packs the IDs into a transferable Uint32Array buffer, posts it to the worker, and receives the sorted result asynchronously. That moves the heavy counting work off the UI thread and avoids an extra copy during transfer.
// ecu-count.worker.ts
self.onmessage = (event) => {
  const ids = new Uint32Array(event.data.ids, 0, event.data.length);
  const counts = new Map<number, number>();
  for (let i = 0; i < ids.length; i++) {
    const id = ids[i];
    counts.set(id, (counts.get(id) || 0) + 1);
  }
  self.postMessage({ ecus: sortCounts(counts) });
};
Similarly, search across millions of frames now uses chunked processing with requestAnimationFrame boundaries. The search input is debounced by 750 ms so that each keystroke does not trigger a full-dataset scan. And when no filters are active, the renderer reads directly from the raw frame array — skipping the cost of building a filtered copy entirely.
What I learned
The Tauri/React stack is genuinely excellent. For 90% of desktop app UI work, it is productive, portable, and fast enough. But “fast enough” has a ceiling, and for high-frequency, high-density data tables, that ceiling is the browser’s DOM rendering pipeline.
The realization was not new to me — a few weeks ago I went through the same arc on iOS, moving from SwiftUI to UIKit to hand-drawn draw(_ rect:) cells. The pattern is identical: high-level frameworks make the common case easy, but when you need to scroll through a million rows of monospaced hex at 60 fps, there is no substitute for owning the pixel pipeline.
What was new is that the web platform actually lets you do this. Canvas 2D is fast, well-supported, and plays nicely with the rest of the React component tree. The table is a canvas, but the toolbar, filter panel, connection panel, and every other part of the UI remain normal React components. You do not have to throw out the framework to escape its hot path.
The takeaway is simple: if your data table has more rows than a spreadsheet, stop asking the DOM to be a spreadsheet.