Blog
Swift beyond Apple, five and a half years later
In October 2020 I wrote that I had decided to go all-in on Swift. Not just on iOS and macOS, where Swift obviously belongs, but pretty much everywhere: servers, command-line tools, reusable frameworks, UNIX-like systems, perhaps one day even the kind of embedded-ish tooling that had followed me around since the OpenMoko days.
Five and a half years later, I no longer think that was the right default.
This is a slightly longer post. Bear with me — I’ve been carrying this around for a while.
TLDR: I still like Swift as a language. I no longer trust Swift as a general-purpose, non-Apple platform strategy.
That distinction matters. Swift is very much alive where Apple needs it to be alive — it’s productive, expressive, type-safe, and still one of the nicest ways to build software for Apple’s platforms. I’ve shipped a lot of Swift code and will continue to do so.
But the dream I had in 2020 was larger than that. I wanted Swift to become my one language for both sides of the wire — client and server, GUI and daemon, app and tool. Shared model code, shared protocol code, shared transport abstractions. Less duplication, fewer mental context switches, more reuse.
I still want that kind of reuse. I just no longer think Swift is the best way to get it outside Apple’s platforms.
What I expected
Back then, Swift felt like it had finally crossed a threshold. Swift 5 had stabilized the ABI on Apple platforms. Swift Package Manager was usable. Server-side Swift had real momentum. The language community felt lively. Concurrency was on the horizon. The open-source story looked credible enough to believe that Swift could grow beyond its birthplace.
And there was a very personal reason why this mattered to me: I hate repeating myself — as previous installments of this column may have revealed ;) I have spent too much of my life building the same abstractions three times because one platform wanted Objective-C, another wanted Python, and the little box in the corner only tolerated C or C++.
Swift seemed to offer a way out. A modern language with value types, generics, protocols, closures, good tooling, and enough C interoperability to talk to the real world. The idea of writing one transport layer, one diagnostics model, one stream abstraction, and using it across desktop tools, mobile apps, and backend services was extremely tempting.
For a while, I really tried.
What actually happened
On Apple platforms, Swift got better. Outside them, it never quite became boring.
And boring is what I want from infrastructure.
When I build a product, the language and build system should be the least interesting part of the day. I don’t want to wonder whether the Linux toolchain is lagging behind, whether Foundation behaves the same way, whether some package assumes Darwin by accident, whether deployment will pull in just the right runtime pieces, or whether the thing that worked last month will suddenly require spelunking through build flags, linker issues, or package manager corner cases.
Yes, all ecosystems have friction. Rust has friction. C++ has historic friction. TypeScript has the whole node_modules universe attached to its ankle. Python packaging can still make grown adults stare silently into the middle distance.
But those ecosystems are at least centered around the platforms where I use them. Rust is at home on Linux. TypeScript is at home on the web. C++ does not depend on one vendor’s platform priorities.
With Swift outside Apple, I kept having to account for the fact that these targets are not what the ecosystem optimizes for first.
Open source is not the same as independence
In 2020 I wrote, enthusiastically, that Swift being open source was the number one feature that had always irritated me with Objective-C.
I still think open source matters. But I also learned, or perhaps relearned, that an open repository is not the same thing as an independent ecosystem.
Swift may be open source, but Apple still sets most of the practical priorities: the language direction, the release rhythm, the documentation focus, the tooling, the flagship frameworks, the developer mindshare, and the commercial incentives. Apple created Swift to serve Apple’s needs, period — and it never pretended otherwise, so I can’t even be angry about it. Much.
The problem starts when I build non-Apple products on top of that assumption and pretend it is neutral infrastructure.
If a language is effectively owned by one platform vendor, then depending on it outside that platform becomes a business decision, not just a technical one. I wrote something very similar back in 2011, when Nokia dropped Maemo and HP killed WebOS: you can’t trust any company to continue working on anything, business demands are what counts. Apparently I needed to relearn that lesson with a programming language. Will it still work? Probably. Will someone fix the rough edges that matter to my Linux daemon, Windows desktop helper, CAN tool, or server process with the same urgency as a problem that affects Xcode and iOS? That is a very different question.
For hobby projects, this is tolerable. For products, it becomes part of the risk calculation, and I have become much less willing to accept that risk.
The momentum problem
The other thing that faded was the feeling of momentum.
In 2020, Server-side Swift felt like a movement. Vapor, SwiftNIO, package libraries, community energy, people trying to prove that Swift could be more than “the new Apple app language”. It was fun to watch, and even more fun to participate in.
Today, from my corner of the world, it feels much quieter — not gone, not useless, but no longer something I expect to become the default outside Apple’s platforms.
When you choose a platform for long-lived software, you want the boring confidence that the ecosystem will be larger next year, the tooling smoother, the weird bugs rarer, the deployment story more standardized, the hiring pool less exotic, the dependency graph healthier.
With Swift outside Apple, I mostly feel the opposite now: more caveats to check before the actual product work can begin.
Some of it is technical. Some of it is social. Some of it is simply that the rest of the world moved on. Rust became the obvious answer for a lot of systems work. TypeScript won the UI tooling war by being everywhere. Python remains annoyingly useful. Modern C++ is, much to my younger self’s surprise, pretty good again in the places where C used to be the only realistic answer.
That does not make Swift a bad language. It just means it stopped being the obvious answer for the work I do outside Apple’s platforms.
What replaced it
My recent projects tell the story better than a theoretical argument.
When I migrated this website away from Lektor, I moved to Zola. Not because I wanted to join a Rust fan club, but because a single binary static site generator with no Python runtime, no virtualenv, and builds under a second is exactly the kind of boring I like.
When CANcorder grew into a serious desktop application for macOS, Windows, and Linux, I didn’t reach for Swift. I used Tauri: TypeScript and React for the UI, Rust for the backend, and a native shell around it. That stack has its own tradeoffs, as the two-million-CAN-frame table happily reminded me, but the deployment target and the ecosystem match the job.
When I returned to MCU work on the ESP32, I went back to C++ (as reported). I didn’t expect to ever write that sentence, but modern C++ is no longer the language I left behind two decades ago. Type inference, move semantics, coroutines, ranges, and decent embedded toolchains make it a perfectly reasonable choice for FreeRTOS abstractions and hardware-adjacent code.
When I need quick automation, glue, importers, converters, and diagnostic helpers, Python still earns its keep. (In 2020 I wrote that server-side Swift and SPM had the power to replace my use of Python forever. Well. That didn’t happen.) It’s not my favorite language in the abstract, but it’s often the fastest way to get from problem to solved problem.
And on the web, TypeScript is simply there. The libraries, the tooling, the debugging story, the browser APIs, the hiring market, the amount of production use — all of it points in the same direction. I may grumble about the ecosystem, but I do not have to explain why I chose it.
That is the pattern now:
- Mobile and Apple-native apps: Swift, SwiftUI where it fits, UIKit/AppKit where it must.
- Desktop products: TypeScript/React plus Rust via Tauri.
- Systems and performance-sensitive backend pieces: Rust.
- Embedded and RTOS work: modern C++.
- Glue, tooling, and quick data work: Python.
It gives me more stacks to keep in my head, but fewer fights with the wrong tool.
A data point from this month
While I was writing this, I decided to stress-test the argument with my own hands. I took a Swift project of mine — a small NAT-traversal broker for automotive diagnostic sessions, around 750 lines of state machine and socket plumbing — and rewrote it in Rust. Same REST contract, same wire format, same behaviour. Two afternoons, with AI doing most of the typing.
That part is worth mentioning, too: AI agents seem to have a surprisingly good time writing Rust. The compiler gives them a tight feedback loop, the ecosystem is explicit, and the resulting patches are often easier to review than the same amount of concurrency-heavy Swift. For the kind of focused porting work I do more and more these days, that is very helpful.
I was not chasing performance. I wanted the maintenance surface to feel less precarious: no Foundation-on-Linux quirks, no third-party socket fork on a noTLS branch, no swift-server runtime to babysit inside a 200 MB Docker image. A tiny stripped binary in a small runtime image was, frankly, the headline feature.
But I also built a small benchmark on top of both versions, just to know, and ran it on the same machine, same loopback, same client. After correcting the benchmark harness to count bytes actually delivered to the receiving side, the numbers became less theatrical, but still pointed in the same direction.
| Concurrent sessions | Swift broker | Rust broker |
|---|---|---|
| 1 | 1,571 MiB/s | 2,989 MiB/s |
| 4 | 1,104 MiB/s | 2,039 MiB/s |
| 16 | 1,664 MiB/s | 1,827 MiB/s |
| 64 | 1,304 MiB/s | 1,544 MiB/s |

All rows passed wire verification in both directions. The Swift broker also allocated all 64 sessions in this rerun, so the earlier “0/64 sessions” result was too strong. What did remain was the lifecycle problem: after every default-logging run in this sweep, the Swift broker process exited with SIGPIPE and no useful application-level log. The Rust broker stayed up until explicitly stopped.
The throughput delta is therefore not the main story. Yes, Rust was faster across the sweep, from about 1.1× at sixteen sessions to about 1.9× for a single session. But what unsettled me more was still the disappearance after the benchmark: no stack trace, no clean shutdown path, just a missing PID after the client finished. The most likely culprit remains teardown around the thread-per-connection forwarding model — exactly the kind of failure mode I don’t want in a small broker daemon.
In production, that kind of lifecycle fragility is a reconnect-storm hazard. If the broker restarts while devices are connected, all of them will try to reallocate at the same moment. The Swift implementation could push bytes, but it did not give me the operational confidence I wanted. The Rust port, with one tokio task per slot and no per-chunk locking, survived the same tests without drama.
I didn’t start this rewrite to prove a point about Swift. The result made the original argument much harder to ignore.
Where Swift still wins
Don’t get me wrong, I’m not moving away from Swift where Swift is the native language of the platform.
For iOS, iPadOS, watchOS, and visionOS, Swift remains the default answer. On macOS, it still makes sense when the project is an Apple-native app or a companion to the mobile side. Recent work on RetroPlayer and the CANcorder iPhone companion app made that obvious again. Even when SwiftUI hit its performance ceiling and I had to go back to UIKit and hand-drawn cells for fluid scrolling, Swift itself was not the problem. The language did its job. The framework abstraction was the thing that needed a shorter leash.
That is an important distinction. My disillusionment is not with Swift as syntax, semantics, or type system. I still enjoy writing it. I still like protocols with default implementations, enums with associated values, value semantics, structured concurrency, and the general feeling that many errors are caught before they escape into runtime.
The part I no longer trust is the platform promise.
Swift is a great Apple language. It may even be the best Apple language we have ever had. But I no longer believe it is the language I should bet my non-Apple products on.
It is also no longer my default for non-mobile products just because they could be written in Swift. Desktop tools, servers, CLIs, cross-platform products, and hardware-adjacent utilities now have to earn their stack on their own terms.
Signs of life, watched from a distance
Then again, two corners of the non-Apple Swift world have started to feel less stagnant lately.
There is now an official Swift on Android working group, with a real toolchain effort and proper coordination instead of heroic individuals reinventing the wheel each year. If it sticks, the prospect of sharing model and protocol code between iOS and Android Swift becomes plausible rather than theoretical.
SwiftWasm is the other one. After a long stretch as a side project, it has fresh momentum and a credible path toward upstream integration. Compiling Swift down to small .wasm modules that run in browsers and WASI runtimes is exactly the kind of cross-platform story that justifies the language choice — and it would directly attack the “write everything twice in TypeScript” problem I have been quietly accumulating frustration over.
Both efforts could change the calculation again. I want them to.
But I’m watching from a distance. Until either of them feels boringly reliable, I can’t base product decisions on them.
The cost of almost portable
What has cost me time in practice is the last ten percent of portability.
If a technology clearly does not support a target, you move on. No drama. The decision is made for you. But if it mostly supports the target, you can spend years discovering the missing pieces only after the easy parts are done.
The demo works. The README says Linux. The package builds. The server starts. The CLI runs. Then the real product begins, and suddenly the paper cuts matter: missing APIs, platform-specific assumptions, packaging wrinkles, CI oddities, unfamiliar deployment paths, fewer examples, smaller community, less operational folklore.
None of these are fatal on their own. You can work through them, but they keep taking time away from the work the language choice was supposed to simplify.
I’ve got enough complexity already. Automotive diagnostics, Bluetooth, USB drivers, CAN adapters, ISO-TP reassembly, UI performance, cross-platform desktop packaging — these things bring their own trouble. I don’t need the programming language to add another layer of “almost”.
Conclusion
If 2020 was the year I allowed myself to believe in Swift everywhere, 2026 is the year I am putting the boundary back.
Swift for mobile and Apple-native apps: yes.
Swift as the foundation for all my non-mobile work: no.
That may sound like a retreat, but for me it is mostly a correction. The Apple parts stay in Swift. The other parts no longer get Swift by default.
I still want reusable solutions. I still want fewer duplicated abstractions. I still want clear, type-safe, maintainable code. I have just stopped insisting that one language must provide all of that everywhere.
In 2020, going all-in on Swift felt like the right bet. In 2026, I’m limiting that bet to the platforms where Swift is clearly at home.
If your experience with Swift outside Apple has been different, I’d love to hear about it — I’m all ears. Just don’t expect me to switch back anytime soon ;)
Cheers, :M:
Reverse engineering a USB device driver on macOS
I have been writing a macOS userspace driver for a CAN bus adapter. The device uses a custom USB protocol — bulk endpoints, vendor control transfers, a command language with opcodes and terminators. The Linux kernel has an open-source driver for the same hardware, so porting it should have been straightforward. I read the kernel source, mapped the protocol structures, implemented the init sequence in Rust, and… nothing. The device’s status LED stayed dark. No frames received.
The closed-source macOS driver from the vendor, on the other hand, worked perfectly. Plug in, initialize, green LED, frames flowing. Same device, same bus, same cable.
Obviously the vendor’s driver was doing something different. But what?
The state of USB tracing on macOS
On Linux, you would fire up Wireshark with usbmon, or cat /sys/kernel/debug/usb/usbmon, and have a complete packet-level trace within seconds. On Windows, there is USBPcap. On macOS, there is… nothing comparable.
Let me be specific about the options I considered:
Hardware USB analyzers. The gold standard. A device like a Total Phase Beagle or an Ellisys sits between the host and the device and captures every transaction at the electrical level. They work on any OS, they are completely transparent, and they cost between 1,000 and 10,000 euros. I don’t have one, and buying one to debug a single driver port felt a bit disproportionate (although I was tempted, I must confess).
Wireshark. Supports USB capture on Linux (via usbmon) and Windows (via USBPcap). There is also a macOS XHC20 capture path, but on current macOS it is not the same convenient “start capture, see packets” workflow. In practice it still runs into the same security wall: recent Wireshark guidance points at disabling System Integrity Protection for USB capture on Catalina and later. That put it in the same bucket as dtrace for me: interesting, but not a workflow I wanted for a driver port.
Apple’s Instruments. Has a “USB” trace template, but it records high-level IOKit events — device attach, configuration changes, interface claims. Not bulk transfer payloads. Useless for protocol-level debugging.
The macOS log subsystem. You can enable debug logging for com.apple.usb and com.apple.iokit, but what you get is plugin loading messages, device matching events, and power management transitions. No pipe data.
dtrace. Powerful, kernel-level, could theoretically trace IOKit calls. But on modern macOS, dtrace requires disabling System Integrity Protection — which means rebooting into Recovery Mode, running csrutil disable, rebooting again, doing your trace, then rebooting into Recovery again to re-enable SIP. Even then, many probes are restricted or unavailable in recent macOS versions. Apple has been tightening the screws on dtrace with every release, and it’s unclear how long the remaining functionality will survive — my bet is: not long. I didn’t want to build my workflow on a tool that requires disabling a core security feature and might stop working entirely next year.
Vendor library debug logging. The library advertises a LOG_USB parameter. I enabled it. Nothing happened. Presumably compiled out in the release build. *sigh*
So none of these were viable and I needed another approach.
The IOKit COM interface problem
The vendor library uses the classic IOKit plugin mechanism: it calls IOCreatePlugInInterfaceForService to get an IOCFPlugInInterface, then QueryInterface to get an IOUSBInterfaceInterface. From there, it calls methods like WritePipe, ReadPipe, and ControlRequest through a COM-style vtable.
These vtable calls are indirect — function pointers in a struct, not linked symbols. You cannot interpose the vtable entries just by injecting a library with DYLD_INSERT_LIBRARIES. You also cannot easily patch the vtable, because it lives in read-only memory within the IOUSBLib plugin bundle.
But here’s the thing: the synchronous methods I cared about are wrappers around the IOKit user-client call path. Internally, they end up at IOConnectCallMethod — a regular C function exported from IOKit.framework. That function can be interposed.
DYLD interposition
macOS’s dynamic linker supports a mechanism called DYLD_INSERT_LIBRARIES, which lets you inject a shared library into a process at startup. Combined with the __DATA,__interpose section, you can redirect any dynamically linked function call to your own implementation.
The idea is simple:
- Build a small
.dylibthat defines an interposed replacement forIOConnectCallMethod. - In your version, log the arguments and return values.
- Call the real implementation to let the program proceed normally.
- Set
DYLD_INSERT_LIBRARIES=./your_lib.dylibbefore launching the target.
The tricky part is step 3.
Avoiding the original-symbol problem
In many interposition examples, you call the original function via dlsym(RTLD_NEXT, "function_name"). Apple documents exactly that pattern, and for ordinary dependent-library interposition it is the right first thing to try.
For this logger, I wanted something more deterministic. I was interposing a system framework function from an injected library, inside a process that loaded system IOKit plugins and shared-cache code. I had already hit the classic failure mode: resolve what looks like the original, call it, and end up back in the logger. Infinite recursion, stack overflow, crash.
I tried a few workarounds:
- Thread-local guard variable — useful for preventing accidental re-entry while logging, but not a way to call the real function if you resolved the wrong address.
- Computing the raw address from
dyld_infoexports — possible in theory, but brittle across macOS updates, shared-cache rebuilds, and chained fixups. - Patching the IOUSBLib vtable directly — probably possible with enough
vm_protectgymnastics, but much more invasive than necessary.
The solution
The key insight is that IOConnectCallMethod and IOConnectCallAsyncMethod are two different exported symbols that both end up in the same IOUserClient external-method machinery. If you only interpose IOConnectCallMethod, you can call through to IOConnectCallAsyncMethod with MACH_PORT_NULL as the wake port. With no async wake port, IOKit takes the synchronous method path — and the dynamic linker routes the call to the real IOConnectCallAsyncMethod, because that symbol was never interposed.
kern_return_t my_IOConnectCallMethod(
    mach_port_t c, uint32_t sel,
    const uint64_t *si, uint32_t sic,
    const void *is, size_t isc,
    uint64_t *so, uint32_t *soc,
    void *os, size_t *osc)
{
    // Log the outbound data
    if (isc > 0 && is) hex_dump("OUT", is, isc);

    // Call the real implementation via the non-interposed sibling.
    // MACH_PORT_NULL keeps this on the synchronous method path.
    kern_return_t kr = IOConnectCallAsyncMethod(
        c, sel, MACH_PORT_NULL,
        NULL, 0, si, sic, is, isc,
        so, soc, os, osc);

    // Log the inbound response
    if (osc && *osc > 0 && os) hex_dump("IN", os, *osc);
    return kr;
}

DYLD_INTERPOSE(my_IOConnectCallMethod, IOConnectCallMethod)
Build it, inject it, run the vendor’s driver — and the USB traffic that this library sends through IOUSBLib flows through your logger. Control transfers, bulk writes, bulk reads, all of it — without any SIP bypass, kernel extension, or hardware USB analyzer. Just 60 lines of C.
What the trace revealed
The trace immediately showed why my driver didn’t work. Two differences jumped out:
Transfer size. The device operates at USB Full Speed (12 Mbps). Every command I sent was in a 16-byte bulk transfer — the command payload plus a terminator, tightly packed. The vendor’s driver sent every command as a 512-byte transfer request, padded with zeros. That is not a single USB packet on Full Speed; the host controller splits it into endpoint-sized packets. But at the transfer level, the device clearly expected a fixed-size command block. The firmware silently discarded the short writes.
Terminator format. I was using 8 bytes of 0xFF as the end-of-command marker, following what I thought the Linux kernel source was doing. The vendor used a 2-byte marker: a specific opcode value (0x03FF), which is the maximum valid opcode in the protocol — essentially a “no-op, stop processing” sentinel. The 8-byte version was never part of the protocol at all; I had misread the kernel constant.
Neither issue produced an error. The device accepted the USB transfers, returned success codes, and maintained its connection. It just didn’t execute the commands. Silent failure — the worst kind. True readers of this column may remember my modem adventures… welcome to the dark, again.
The fix
Once I knew the real wire format, the fix was trivial: build a 512-byte command buffer, pad the unused bytes with zeros, and use the correct 2-byte terminator. The device came alive immediately — green LED, frames flowing, exactly as with the vendor driver.
What I learned
The Linux kernel driver was not wrong. It works perfectly — in the kernel. The kernel’s USB stack submits URBs to the host controller, which handles packetization, short packets, and endpoint details. It will not invent protocol padding for you, though; somewhere in the Linux driver path, the submitted command buffer length was already correct. I missed that because I focused on the command payload and not on the transfer length.
In userspace, with libusb or IOKit, that length is right in your face. If you pass 16 bytes to WritePipe, the device gets a 16-byte transfer. The details that looked like transport trivia suddenly become part of the protocol.
I also learned that “read the open-source driver and reimplement” is not always sufficient. The open-source driver operates in a different environment with different abstractions, and the protocol’s wire-level requirements may be invisible at the source code level. Sometimes you need to look at the actual bytes on the wire — even if that means reverse engineering the one driver that already works. (Funny, by the way: in 2007 I complained that reverse engineering is a terrifically time-consuming approach. For an entire phone platform, that’s still true. For one USB protocol, it’s an afternoon.)
The DYLD interposition technique is now a permanent tool in my debugging toolbox. It works on the kinds of binaries I usually control — Homebrew-installed tools, local helpers, custom test harnesses — as long as dyld interposition is allowed. SIP-hardened system binaries are excluded. It is not a bus analyzer, and it will not see kernel clients or code paths that bypass the symbol you interpose. But for user-space libraries that talk to IOKit user clients, it can turn an opaque driver into a very useful byte stream. And unlike dtrace, it doesn’t require disabling System Integrity Protection.
Sixty lines of C. That’s what stood between “the device does not work” and “here is every byte the working driver sends.” Not bad for an afternoon, if I may say so :)
Cheers, :M:
ImpossiBLE — BLE back in the iOS Simulator
For a while, Bluetooth Low Energy in the iOS Simulator was one of those things that half-worked often enough to be useful. It was never a perfect substitute for a real device — Bluetooth never is — but it helped. You could at least keep the edit/build/run cycle on the Mac while working on UI, parsing, state machines, and the boring-but-important parts around the actual radio.
And then, at some point, it was gone.
Apple didn’t bother with a deprecation notice, a replacement, or an explanation — it just stopped working, the way things you quietly rely on tend to do. *sigh* CBCentralManager sits in a state that is not useful, scans do not discover anything, and you are back to launching on hardware for every little iteration. If your app talks to BLE hardware, the simulator becomes a very expensive screenshot viewer.
That annoyed me enough (and yours truly annoys easily) to build ImpossiBLE.
The bridge
The original idea is simple: keep your iOS app code unchanged, but intercept the CoreBluetooth calls in the simulator and forward them to a small macOS helper. The helper runs on the Mac, talks to the real Bluetooth controller via CoreBluetooth, and sends the results back over a Unix domain socket.
From the app’s point of view, it still uses CBCentralManager, CBPeripheral, services, characteristics, descriptors, notifications, RSSI, and L2CAP channels. Under the hood, ImpossiBLE swizzles the simulator-side CoreBluetooth entry points and shuttles newline-delimited JSON through /tmp/impossible.sock.
It’s not magic, just a pragmatic tunnel around a missing feature.
There are a few details that make it pleasant in practice:
- Multiple
CBCentralManagerinstances are handled independently. - Service filters are enforced to match iOS behavior, even where macOS CoreBluetooth is more liberal.
CBManagerStatetracks the socket provider, so starting or stopping the helper produces a usefulpoweredOn/poweredOfftransition.- The simulator side auto-reconnects, so the provider can start before or after the app.
- The app code does not need a special ImpossiBLE mode.
For real hardware, that already gets a lot of day-to-day BLE work back into the simulator.
The mock provider
The new part is that the provider doesn’t have to be real Bluetooth hardware anymore. With ImpossiBLE Mock 2.0.0, the menu bar app has also grown into the control surface I wanted it to be: still small enough to live in the menu bar, but explicit about what is running and what the simulator is doing.
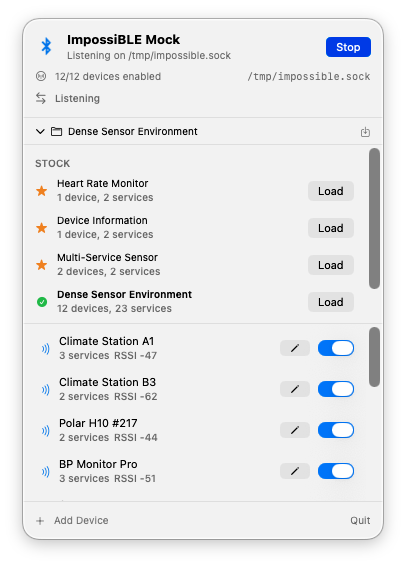
ImpossiBLE ships with a macOS menu bar app called ImpossiBLE Mock. It listens on the same /tmp/impossible.sock socket as the forwarding helper, but instead of talking to the Mac’s Bluetooth hardware it serves virtual peripherals from an editable configuration.
A segmented Off / Mock / Passthrough control at the top switches between modes. Selecting one automatically stops the other, so you never have to worry about which provider is running. The menu bar icon changes to match: a strikethrough Bluetooth symbol when off, the plain symbol when forwarding real hardware, and a dot-badged variant when mocking.
The panel is now a persistent, borderless menu bar window rather than a regular transient menu. It stays open while you switch to the simulator or Xcode, can be toggled from the status item, and remains centered under the menu bar icon. If you prefer classic menu behavior, a Dismiss on Switch setting brings that back.
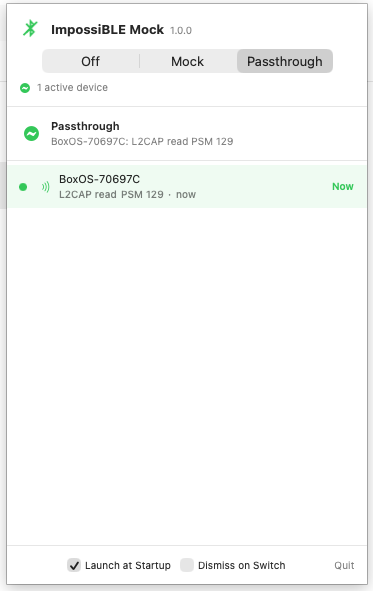
In passthrough mode, the mock device list is replaced by a dedicated status view — no clutter from irrelevant configuration UI. It now shows the devices the simulator app actually talks to. Discovery alone is deliberately not enough to enter the list; a device appears only after real GATT or L2CAP activity such as reads, writes, subscriptions, or channel traffic. If multiple devices are active, the currently communicating one is highlighted with its latest operation and a small Now marker.
The same activity also drives the menu bar icon pulse, so forwarding no longer looks static while real work is happening behind the socket.
In mock mode, the full device editor and configuration management are available.
The iOS app still doesn’t know the difference. It scans, discovers, connects, reads, writes, subscribes, and receives delegate callbacks as usual. Only the provider behind the socket changes.
The mock app comes with a few stock configurations: a heart rate monitor, a device information peripheral, a multi-service sensor, and a dense sensor environment with a dozen devices. You can edit device names, RSSI, connectability, advertised service UUIDs, manufacturer data, services, characteristics, descriptors, characteristic properties, initial values, and simple pairing/security behavior. Custom configurations can be saved and restored. A Launch at Startup checkbox in the footer installs a LaunchAgent, so the app can start automatically at login regardless of where it is installed.
This is especially useful for the parts of BLE development that are usually tedious to reproduce:
- testing scan result ordering and filtering without walking around the room;
- exercising UI states for empty, sparse, and crowded environments;
- checking descriptor discovery and notification setup;
- simulating devices that require pairing or encrypted characteristics;
- keeping a deterministic test setup for demos and screenshots.
The menu bar icon also flashes on socket traffic, which is a tiny thing, but very helpful when you’re wondering whether the simulator is actually talking to the provider.
Capturing real devices into mock configurations
Building mock configurations by hand is fine when you know exactly what services and characteristics your target device exposes. But sometimes you just want to grab what’s already in the air and turn it into a test fixture.
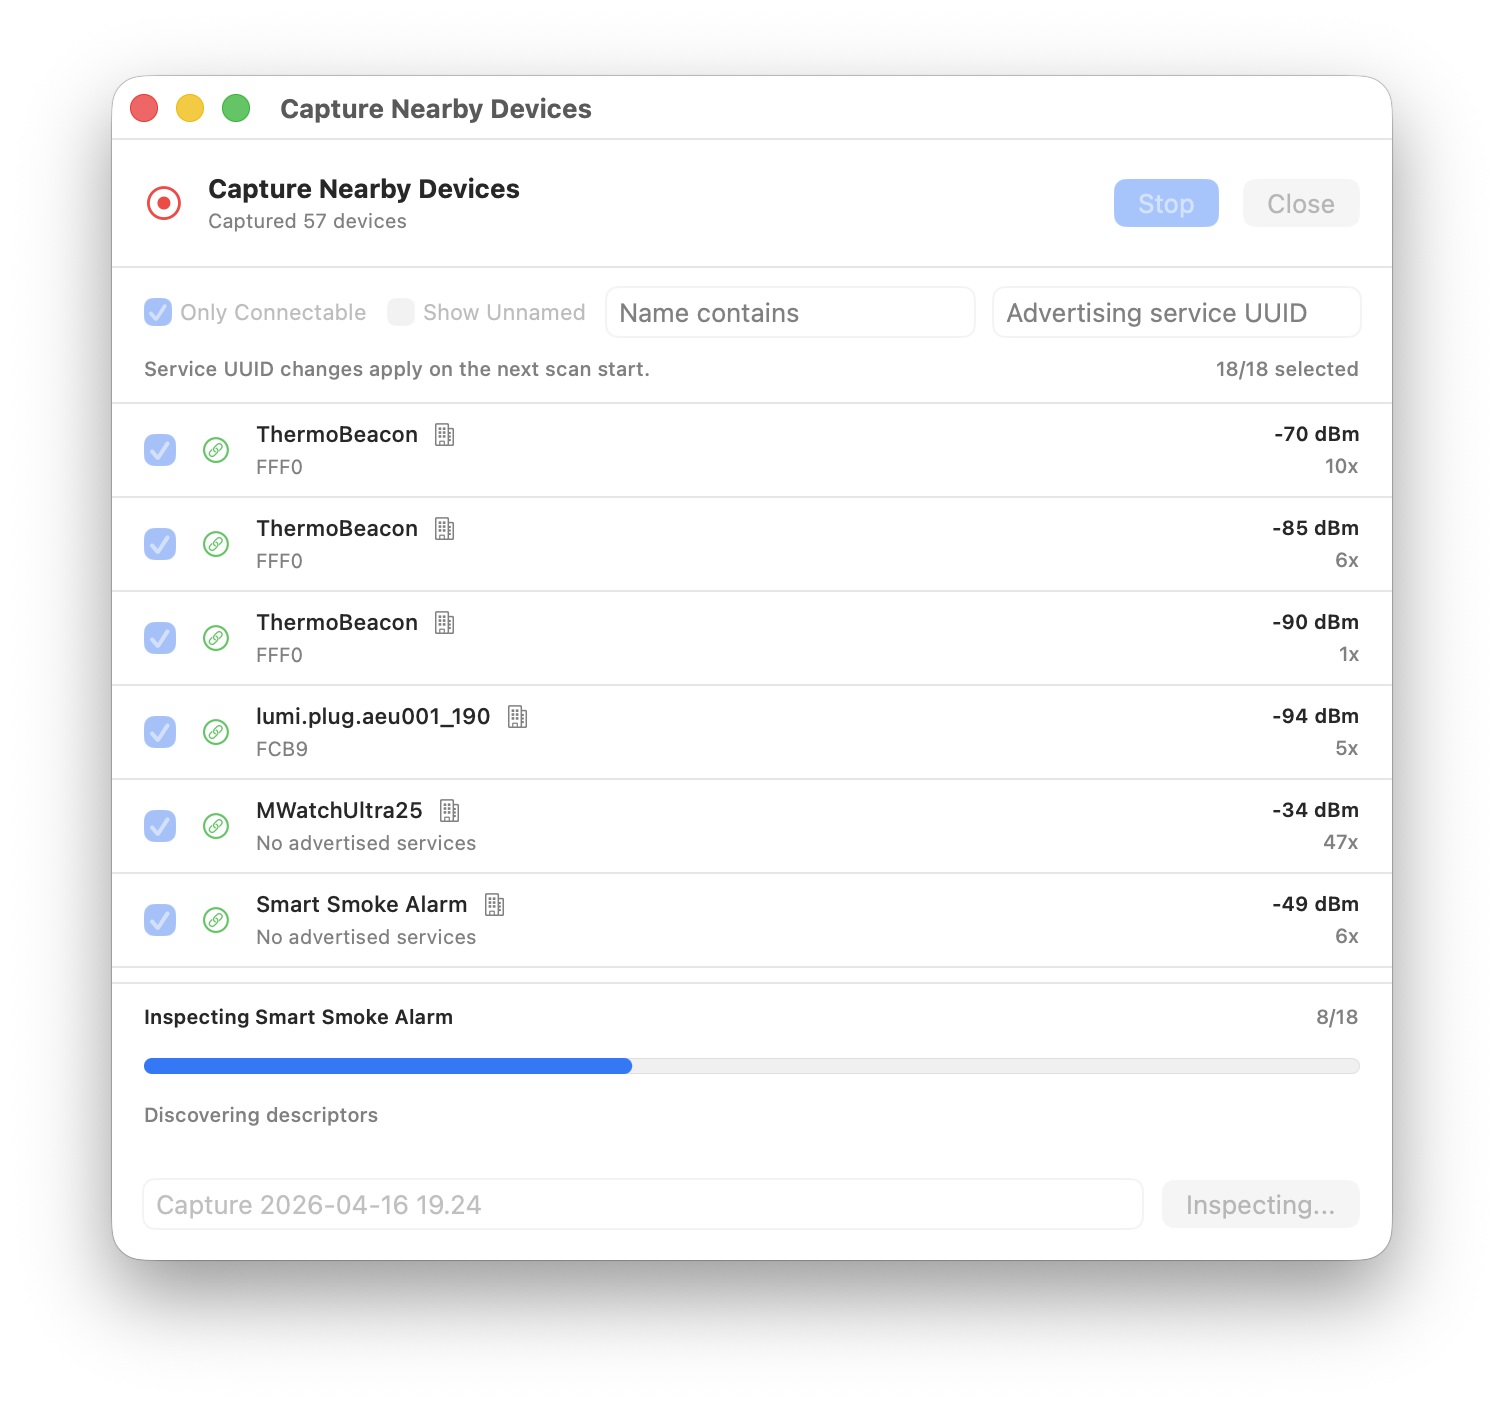
The mock app now includes a Capture mode that scans for nearby BLE advertisements and lets you cherry-pick devices to include in a new configuration. The scan results are sorted by likely usefulness — devices with more advertised services, names, connectability, and manufacturer data float to the top. Unnamed devices are hidden by default to cut through the noise, but you can reveal them when needed.
When you save a capture, ImpossiBLE goes a step further for connectable devices: it connects to each selected device, discovers its full GATT tree — services, characteristics, descriptors — and reads any values that CoreBluetooth allows. The result is a mock configuration that mirrors what the real device actually exposes, not just what it advertises. Devices that are not connectable or fail to connect are still saved from their advertisement data alone.
This closes a nice loop: scan the room, pick the interesting devices, save, and immediately test against a faithful replica without needing the real hardware powered on.
Installation
The repository is here:
https://github.com/mickeyl/ImpossiBLE
For Homebrew users:
brew install mickeyl/formulae/impossibleThat installs the helper and the mock menu bar app. This is a developer tool, so I’m not trying to pretend it’s a polished end-user product. The Homebrew formula builds it locally and signs the mock app ad-hoc; if you want a notarized distributable app bundle, the Makefile has the pieces for that as well.
If you prefer to work from the checkout:
git clone https://github.com/mickeyl/ImpossiBLE.git
cd ImpossiBLE
make install
make run        # real BLE forwarding
make mock-run   # virtual BLE provider
make mock-relaunch  # rebuild and reopen the mock menu bar app during development
Only run one provider at a time. Both the real helper and the mock app own /tmp/impossible.sock.
Is this a replacement for device testing?
No.
Radio behavior is still radio behavior. Timing, connection stability, hardware quirks, pairing dialogs, background behavior, and all the lovely little platform-specific edge cases still need real devices. ImpossiBLE is not meant to remove that step.
What it does remove is the need to go to hardware for every small iteration. If I’m polishing a scan UI, checking a parser, debugging a state machine, or testing how an app reacts to a dense BLE environment, I can now stay in the simulator. That’s a big enough win to justify the tunnel, the swizzling, the socket protocol, and the slightly cheeky name (sorry, couldn’t resist ;)).
Apple may have silently taken BLE away from the simulator. Fine. I put it back :D
If you’re doing BLE work and something is missing, let me know — I’m all ears.
ImpossiBLE has since become the first member of a larger family. “Simsalabim — giving the iOS Simulator hardware powers” explains how the same idea now covers cameras, NFC, and realistic simulator data in one menu-bar suite.
Two million CAN frames and the limits of React
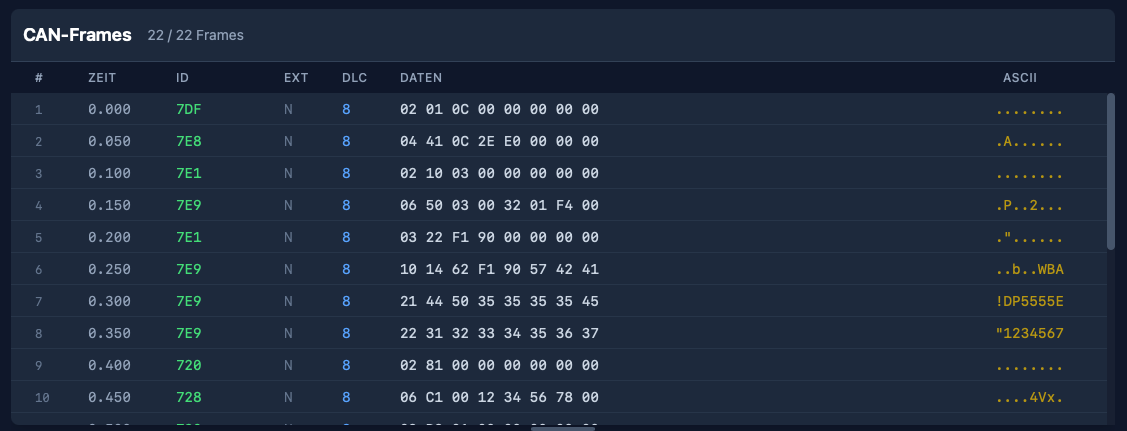
CANcorder, my CAN bus logger and analyzer, is built with Tauri 2 and React 19. It is a desktop app for macOS, Windows, and Linux — written in TypeScript on the frontend, Rust on the backend, and held together by Tauri’s IPC bridge. For the first year of development, this stack felt like a gift — which is a remarkable thing for me to write, given that in 2015 I declared web technology a mess and swore to stick to native clients, and in 2013 I grumbled about cross-platform tools ruining the market. I’ve changed my mind. Partly. Components are quick to write, state management is straightforward, and the iteration speed of hot-reloading a web view inside a native shell is hard to beat.
Then someone opened a 2.4 million frame CAN log from a vehicle test.
What “fast enough” used to mean
In the early days, the frame table was a straightforward React component. Each visible row was a <div> with child elements for index, timestamp, arbitration ID, DLC, hex data, and ASCII. The ISO-TP (transport message) table was similar, with the additional complexity of expandable protocol hint sections. Both tables used virtual scrolling — the frame table via a hand-rolled implementation, the ISO-TP table via @tanstack/react-virtual — so the browser only ever had to maintain DOM nodes for the rows you could actually see.
For a few thousand frames this was fine. Even for tens of thousands it was workable. But CAN traffic in the real world isn’t a few thousand frames. A typical bus runs at 500 kbit/s and carries hundreds of frames per second. Record for an hour and you are looking at a million rows. Record a vehicle test session and the number can easily double.
At that scale, the React/DOM approach started to fall apart — not in one dramatic failure, but in a steady accumulation of small costs that added up to big latency.
Death by a thousand DOM nodes
The fundamental problem isn’t React. React’s reconciliation is actually quite good at what it does. The problem is what lies beneath: the browser’s rendering pipeline.
Every visible row is a subtree of DOM elements. Each element participates in style resolution, layout, paint, and compositing. The virtualizer makes sure only ~30 rows exist at any given time, but scrolling means destroying and creating those subtrees at 60 fps. That means: allocate nodes, attach them to the document, compute styles, run layout, paint layers, composite. Every frame. At every scroll position.
For modest data sets, the browser handles this without breaking a sweat. But when you add row selection highlights, search match indicators, colored arbitration IDs, hex formatting, ASCII previews, and measurement deltas — each with its own element and style — the per-row cost becomes nontrivial. Multiply by the rows that enter and leave the viewport during a single scroll gesture, and you start dropping frames.
The ISO-TP table was worse. It has variable-height rows (expandable hint sections, expandable data previews, status icons), so the virtualizer needed to measure row heights dynamically. That meant even more layout work per scroll event, and the height estimates had to be continuously recalculated as sections were toggled open and closed.
The intermediate steps
Before the big rewrite, I tried the obvious optimizations:
Batched frame ingestion. The Rust backend switched from emitting one Tauri event per CAN frame to batching up to 256 frames per event, flushed every 16 ms. The frontend stored incoming frames in refs rather than state, and flushed them to the React render cycle via
requestAnimationFrame. This reduced the number of React re-renders from “one per frame” to “one per animation frame” — a huge win for live capture throughput, but it did not help with scroll performance on large static datasets.Memoized row components. Wrapping each row in
React.memoprevented unnecessary re-renders when sibling rows changed. Good practice, but the real cost was not re-rendering existing rows — it was mounting and unmounting rows at the scroll edges.Deferred filtering. For large datasets (>50,000 frames), filter computation was split into chunks via
requestAnimationFrameso the UI remained responsive during rebuilds. Again, helpful for filter changes, but orthogonal to scroll performance.
All of these were necessary, but none of them were sufficient. *sigh*
The canvas rewrite
The solution was to stop asking the browser to manage a DOM subtree for every row — and draw the table by hand.
Both FrameTable and IsoTpTable were rewritten from React component trees to imperative Canvas 2D renderers. The React component now owns a single <canvas> element. A FrameTableRenderer class (and its IsoTpTableRenderer counterpart) paints the visible rows directly:
render(scrollTop: number) {
  const ctx = this.ctx;
  ctx.fillStyle = this.colors.get("table-panel-bg") || "#0f172a";
  ctx.fillRect(0, 0, this.width, this.height);

  const startIndex = Math.floor(scrollTop / ROW_HEIGHT);
  const endIndex = Math.min(
    totalRowCount,
    Math.ceil((scrollTop + this.height) / ROW_HEIGHT) + 1
  );

  for (let i = startIndex; i < endIndex; i++) {
    // draw row background, indicator, index, timestamp,
    // arbitration ID, type, DLC, hex data, ASCII — all via
    // fillRect and fillText, no DOM involved
  }
}
No DOM nodes, no style resolution, no layout engine, and no compositing layers per row — just fillRect and fillText, driven by a scroll offset.
The renderer reads CSS custom properties once (via getComputedStyle) to pick up the theme colors, then paints at native speed. The <canvas> is scaled by devicePixelRatio for crisp text on Retina displays. And because there is only one DOM element — the canvas itself — the browser’s per-frame work is trivially small: composite one layer, done.
Scroll compression
There is a subtle problem that only appears at extreme scale: browsers impose a maximum scrollable height. Who would have thought… In practice it is on the order of tens of millions of pixels, so at 32 pixels per row you can hit it a little past the million-row mark. Past that point, scrollTop values get clamped, and the bottom of the dataset becomes unreachable.
The fix is a scroll compression function:
const MAX_NATIVE_SCROLL_HEIGHT = 33_000_000;
const COMPRESSED_SCROLL_HEIGHT = 250_000;

function createScrollCompression(totalHeight: number, viewportHeight: number) {
  if (totalHeight <= MAX_NATIVE_SCROLL_HEIGHT) {
    return { enabled: false, /* identity mapping */ };
  }

  const scrollContentHeight = Math.max(viewportHeight, COMPRESSED_SCROLL_HEIGHT);
  return {
    enabled: true,
    scrollContentHeight,
    actualToVirtual: (scrollTop) =>
      (scrollTop / (scrollContentHeight - viewportHeight))
        * (totalHeight - viewportHeight),
    virtualToActual: (scrollTop) =>
      (scrollTop / (totalHeight - viewportHeight))
        * (scrollContentHeight - viewportHeight),
  };
}
The invisible scroll content element is clamped to 250,000 pixels. The actual scroll position is mapped linearly to the virtual row space. The user scrolls through a quarter-million-pixel-tall region while the renderer translates that into two-million-row space. In practice this keeps navigation seamless and the scrollbar position meaningful, even though the native thumb size now reflects the compressed range rather than the full virtual height.
Getting work off the main thread
Canvas rendering removed the paint bottleneck, but there were still moments of jank: opening a large file and watching the UI freeze while ECU detection scanned millions of frames.
The ECU detection — counting unique arbitration IDs and their frequencies — was moved to a dedicated Web Worker. The main thread packs the IDs into a transferable Uint32Array buffer, posts it to the worker, and receives the sorted result asynchronously. That moves the heavy counting work off the UI thread and avoids an extra copy during transfer.
// ecu-count.worker.ts
self.onmessage = (event) => {
  const ids = new Uint32Array(event.data.ids, 0, event.data.length);
  const counts = new Map<number, number>();
  for (let i = 0; i < ids.length; i++) {
    const id = ids[i];
    counts.set(id, (counts.get(id) || 0) + 1);
  }
  self.postMessage({ ecus: sortCounts(counts) });
};
Similarly, search across millions of frames now uses chunked processing with requestAnimationFrame boundaries. The search input is debounced by 750 ms so that each keystroke doesn’t trigger a full-dataset scan. And when no filters are active, the renderer reads directly from the raw frame array — skipping the cost of building a filtered copy entirely.
What I learned
Now, the Tauri/React stack is genuinely excellent — for 90% of desktop app UI work, it’s productive, portable, and fast enough. But “fast enough” has a ceiling, and for high-frequency, high-density data tables, that ceiling is the browser’s DOM rendering pipeline.
The realization wasn’t new to me — a few weeks ago I went through the same arc on iOS, moving from SwiftUI to UIKit to hand-drawn draw(_ rect:) cells. The pattern is identical: high-level frameworks make the common case easy, but when you need to scroll through a million rows of monospaced hex at 60 fps, there is no substitute for owning the pixel pipeline.
What was new is that the web platform actually lets you do this. (The canvas as such is an old love, mind you: I was raving about QGraphicsView at the Trolltech DevDays back in 2006 — “The canvas is back! And it will blow you away.” Twenty years later, it’s still the answer.) Canvas 2D is fast, well-supported, and plays nicely with the rest of the React component tree. The table is a canvas, but the toolbar, filter panel, connection panel, and every other part of the UI remain normal React components. You don’t have to throw out the framework to escape its hot path.
The takeaway is simple: if your data table has more rows than a spreadsheet, stop asking the DOM to be a spreadsheet. Then again, I have a feeling that this won’t be the last time I write about hand-drawn tables… stay tuned ;)
Back to UIKit for fluid scrolling

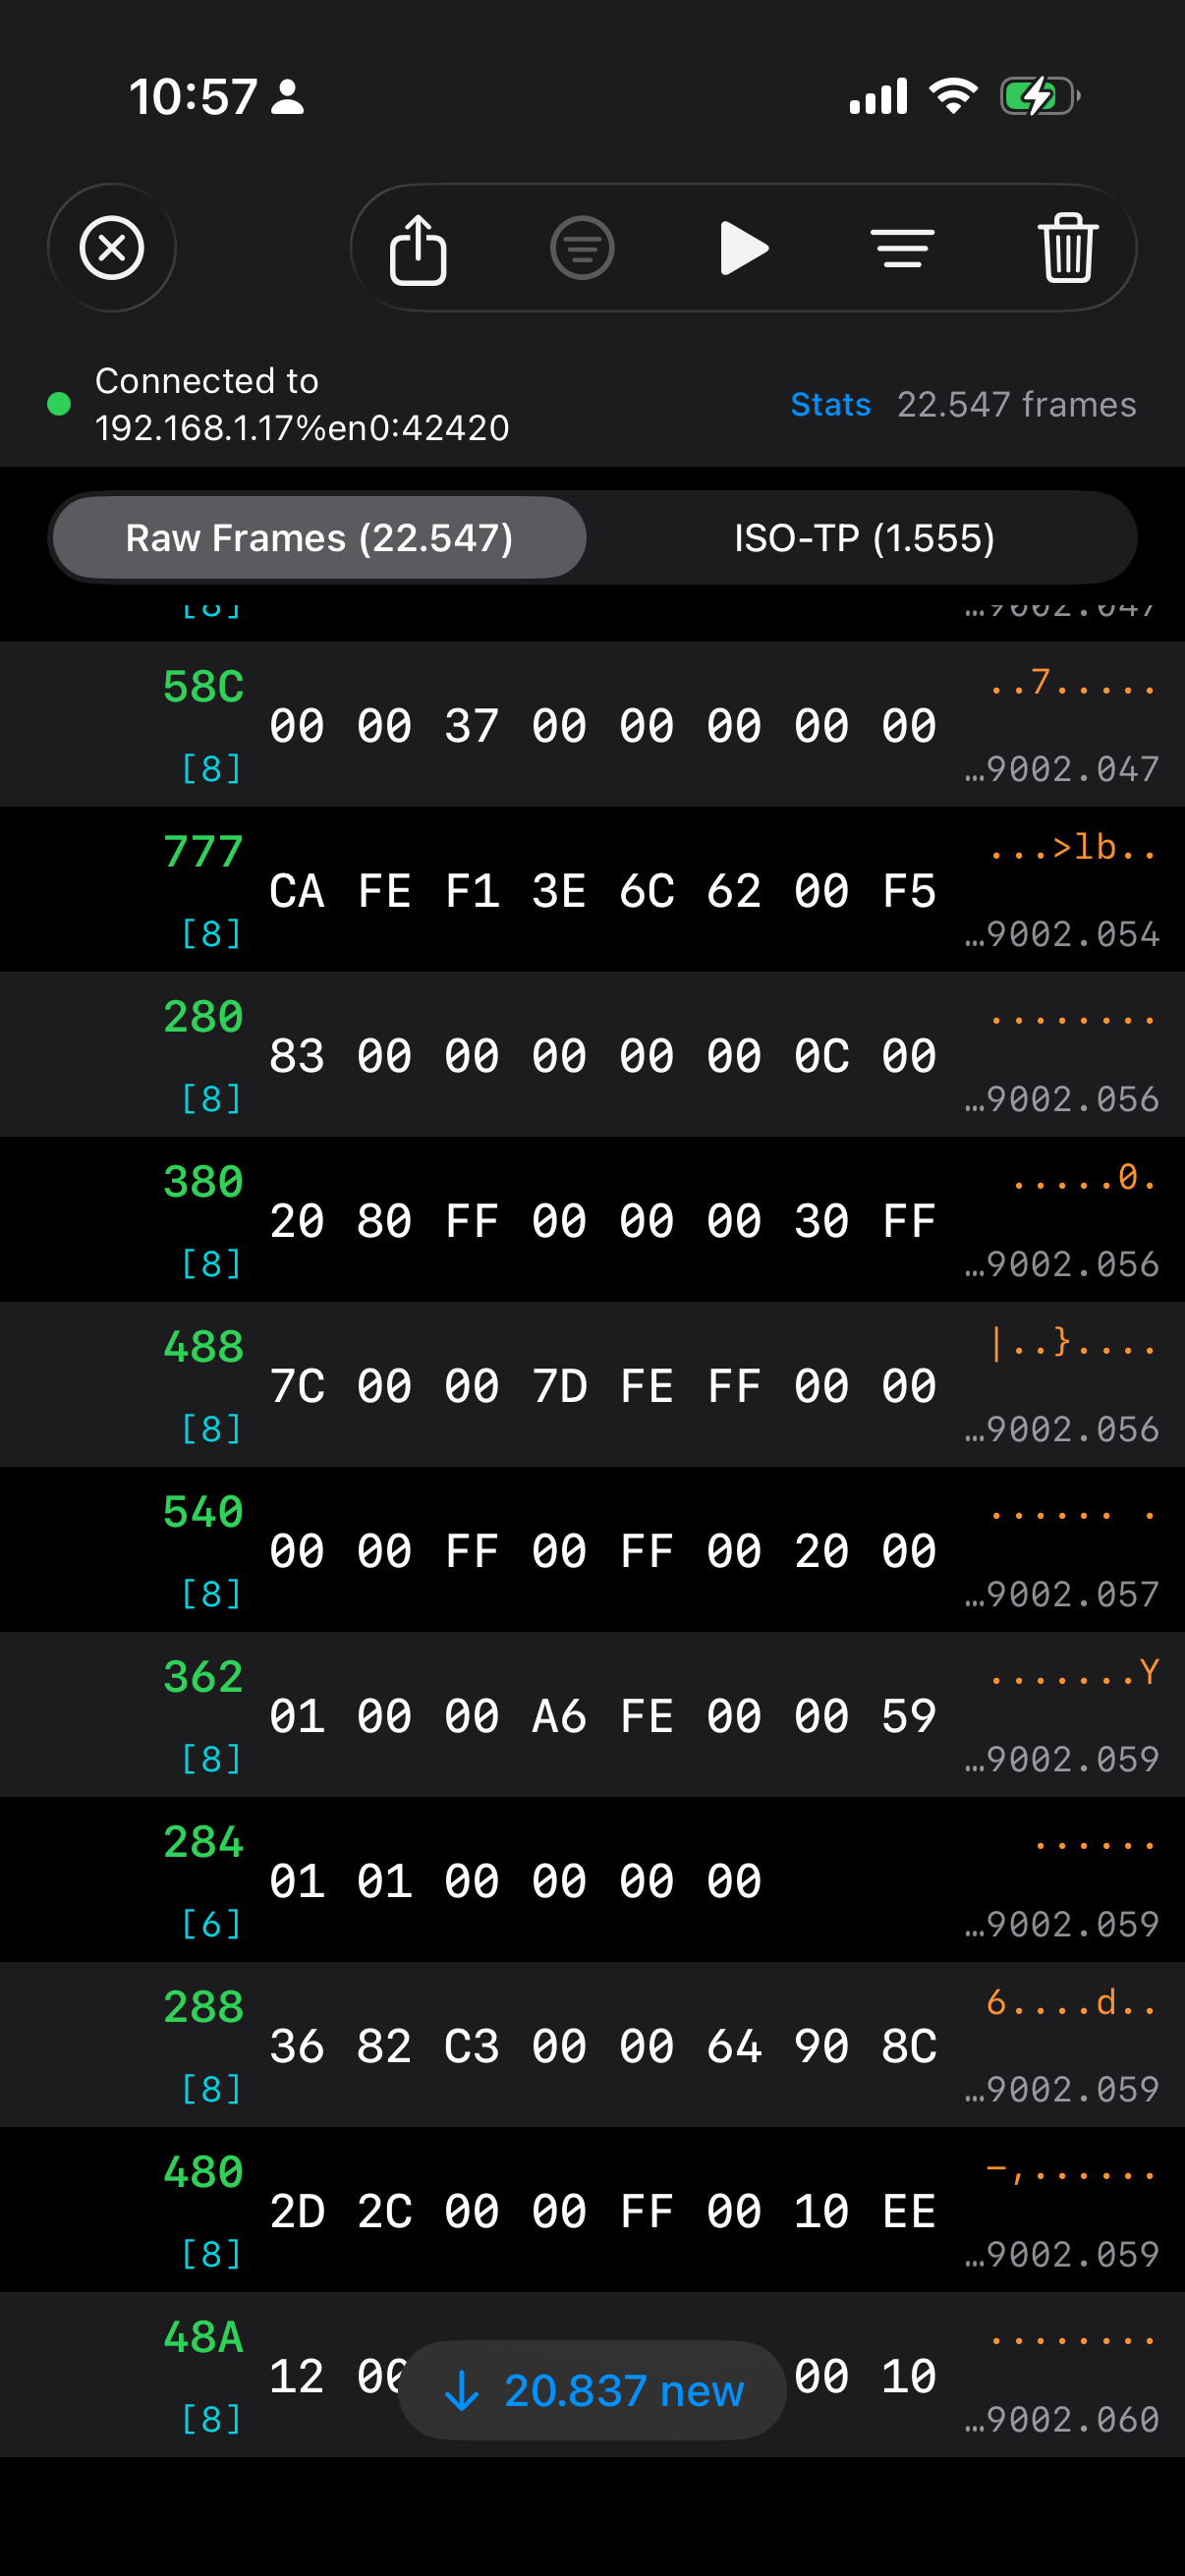
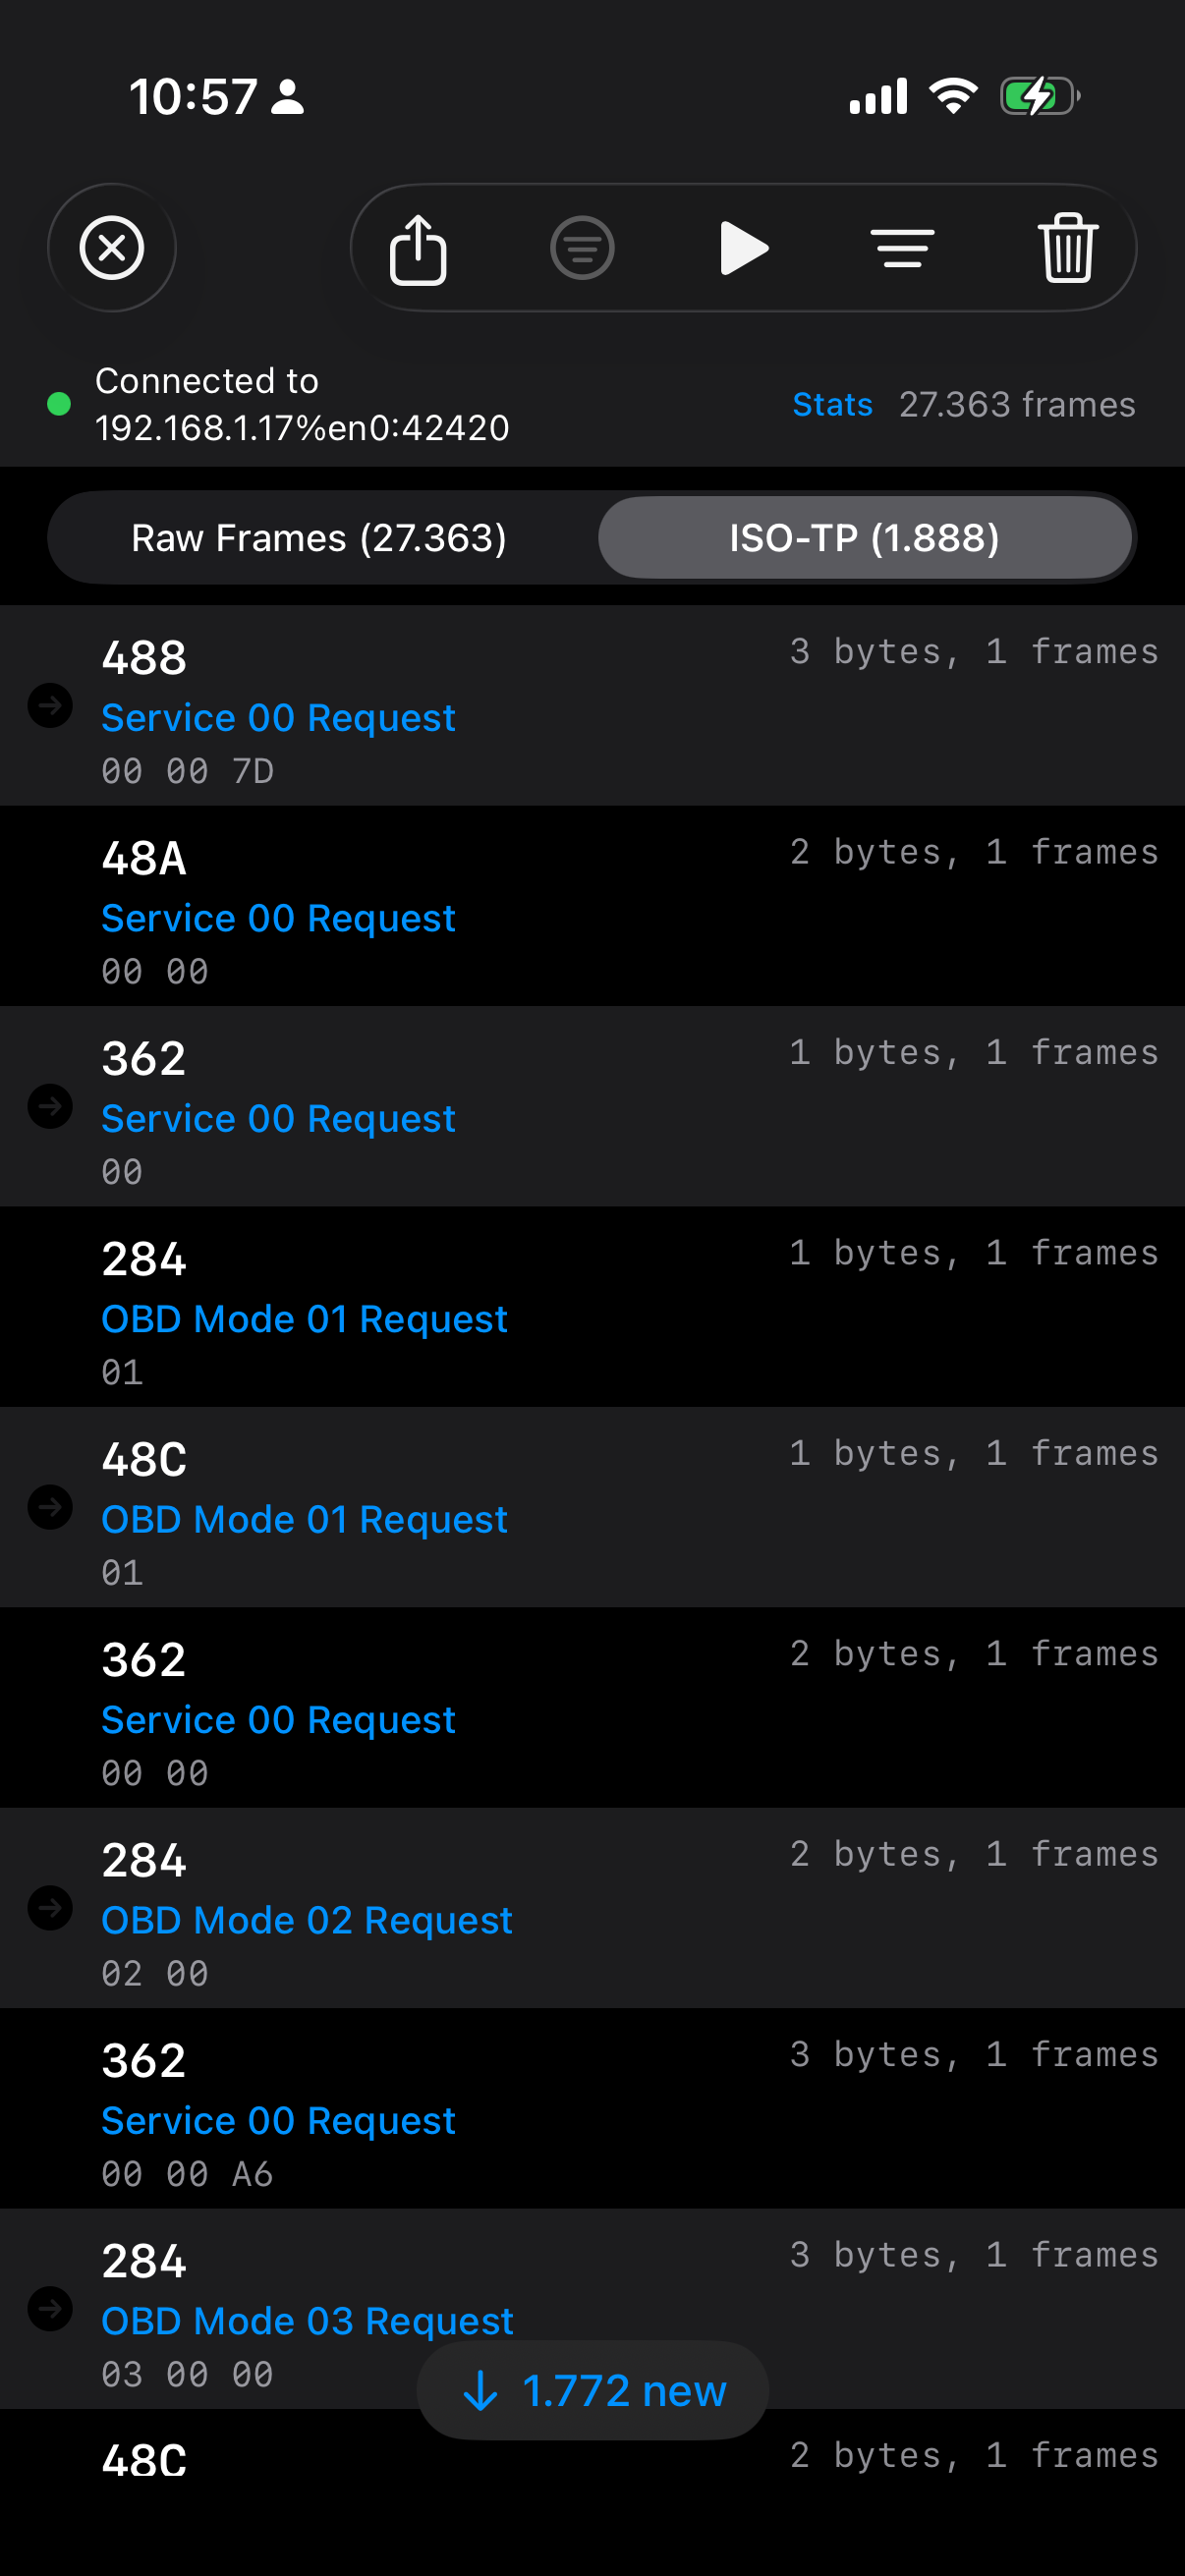
I’ve spent the last couple of days optimizing the iPhone companion app for CANcorder (forthcoming), my CAN bus logger and analyzer. The original iOS frontend was written in SwiftUI, which made it wonderfully quick to build and iterate on. For modest amounts of data, it was fine. But “modest” isn’t what CAN traffic looks like in the real world. Once I attached an ECU that happily sprayed roughly 700 frames per second, the app started to tell a very old story again: pretty abstractions are no substitute for ruthless control over the hot path.
What surprised me is not that SwiftUI eventually hit a wall. What surprised me is where the big win came from. Moving from SwiftUI to UIKit was already worthwhile, but the really major step towards fluid scrolling on modern iPhones came only after going one step further: skipping stack views, skipping Auto Layout, and drawing the rows by hand.
Yes, even on today’s ridiculously powerful devices. Those of you who remember my Gtk+ theming woes from the Openmoko days will not be surprised that I ended up drawing pixels by hand once again ;)
SwiftUI is excellent until it isn’t
I was grumpy about SwiftUI before I had even started using it, but credit where credit is due: SwiftUI is fantastic for the 90% case. If your list has a few hundred rows, occasional updates, and a reasonably static layout, I would still pick it first. The API is productive, state propagation is elegant, previews are pleasant, and you can ship features very quickly.
But a live log viewer with tens of thousands of rows is not the 90% case.
My first implementation used a SwiftUI list-like hierarchy. It worked, but it did too much work on every update: view diffing, text layout, filter recomputation, derived state rebuilding, and all the other little conveniences that feel cheap when the data set is small. Once the frame count climbed into the tens of thousands, scrolling became choppy. Around the six-figure mark, it was obvious that this was not the right tool for the job.
The first refactoring was predictable: move parsing, ISO-TP decoding, filtering, and export work off the main thread. That helped, and it was necessary anyway. But it still didn’t feel right. The UI was better, but not fluid.
UIKit was necessary, but not sufficient
The next step was replacing the SwiftUI row hierarchy with UITableView. That alone already cut a lot of overhead. Cell reuse is still a wonderfully boring and effective idea. There is a reason it has survived so many framework cycles.
However, my first UIKit version was still far from optimal. The cells used UILabel, UIImageView, UIStackView, and constraints. In other words, I had merely replaced one high-level layout system with another slightly older one. This version was better than SwiftUI, yes, but under sustained live ingest it still felt heavier than it should.
This is the version that looked correct on paper:
private final class IsoTpTableCell: UITableViewCell {
    private let iconView = UIImageView()
    private let idLabel = UILabel()
    private let metaLabel = UILabel()
    private let hintLabel = UILabel()
    private let dataLabel = UILabel()

    override init(style: UITableViewCell.CellStyle, reuseIdentifier: String?) {
        super.init(style: style, reuseIdentifier: reuseIdentifier)

        let topRow = UIStackView(arrangedSubviews: [idLabel, UIView(), metaLabel])
        topRow.axis = .horizontal

        let textStack = UIStackView(arrangedSubviews: [topRow, hintLabel, dataLabel])
        textStack.axis = .vertical
        textStack.spacing = 2
        textStack.translatesAutoresizingMaskIntoConstraints = false

        contentView.addSubview(iconView)
        contentView.addSubview(textStack)

        NSLayoutConstraint.activate([
            iconView.leadingAnchor.constraint(equalTo: contentView.layoutMarginsGuide.leadingAnchor),
            textStack.leadingAnchor.constraint(equalTo: iconView.trailingAnchor, constant: 10),
            textStack.trailingAnchor.constraint(equalTo: contentView.layoutMarginsGuide.trailingAnchor),
        ])
    }
}
There is nothing wrong with that code. In fact, for most apps it is perfectly reasonable. But when you want to scroll through 10,000 or 100,000 rows while ingesting live data, every one of those conveniences has a cost. Constraints need solving, views need layout, labels need text measurement, and the cell tree is much larger than the pixels you actually need to paint.
The major step was getting rid of layout machinery
The real breakthrough came when I stopped asking UIKit to build and lay out a mini view hierarchy for every visible row.
Instead, each reusable cell now hosts a tiny canvas view. That canvas measures the available width once per width bucket, chooses the largest monospaced font size that still guarantees visibility of all eight CAN data bytes, and draws the text directly.
No labels, no stack views, no constraints, and no Auto Layout whatsoever.
private final class FrameTableCell: UITableViewCell {
    private let canvasView = FrameRowCanvasView()

    override init(style: UITableViewCell.CellStyle, reuseIdentifier: String?) {
        super.init(style: style, reuseIdentifier: reuseIdentifier)
        selectionStyle = .none
        contentView.addSubview(canvasView)
        canvasView.autoresizingMask = [.flexibleWidth, .flexibleHeight]
    }

    override func layoutSubviews() {
        super.layoutSubviews()
        canvasView.frame = contentView.bounds
    }
}
And the actual row rendering is little more than measured rectangles and direct drawing:
override func draw(_ rect: CGRect) {
    guard let frameModel else { return }

    let metrics = Self.metrics(for: bounds.width)
    let contentRect = bounds.insetBy(dx: 8, dy: 6)

    let idRect = CGRect(x: contentRect.minX, y: contentRect.minY,
                        width: metrics.leftColumnWidth, height: metrics.idFont.lineHeight)

    let dataRect = CGRect(x: contentRect.minX + metrics.leftColumnWidth + 8,
                          y: contentRect.midY - metrics.dataFont.lineHeight / 2,
                          width: metrics.dataColumnWidth,
                          height: metrics.dataFont.lineHeight)

    frameModel.formattedId.draw(in: idRect, withAttributes: idAttributes)
    frameModel.visibleDataText.draw(in: dataRect, withAttributes: dataAttributes)
}
The font fitting is similarly simple and similarly important:
private static func metrics(for width: CGFloat) -> LayoutMetrics {
    let availableWidth = max(0, width - 16)
    let template = "00 00 00 00 00 00 00 00"

    var size: CGFloat = 16
    while size >= 10 {
        let dataFont = UIFont.monospacedSystemFont(ofSize: size, weight: .medium)
        let dataWidth = ceil((template as NSString).size(withAttributes: [.font: dataFont]).width)

        if dataWidth <= availableWidth {
            return LayoutMetrics(dataFont: dataFont, dataColumnWidth: dataWidth)
        }
        size -= 0.5
    }

    return LayoutMetrics(dataFont: .monospacedSystemFont(ofSize: 10, weight: .medium),
                         dataColumnWidth: 150)
}
This may look primitive compared to SwiftUI’s declarative charm, but that is precisely the point: primitive code leaves less work for the runtime.
The other half: only UI on the main thread
There is another rule that became non-negotiable during this exercise: the main thread should do UI, and only UI — not “mostly UI”, and not “UI plus a little convenience formatting” either.
That means:
- TCP receive off the main thread
- CAN frame parsing off the main thread
- ISO-TP decoding off the main thread
- filtering off the main thread
- CSV export off the main thread
- row string precomputation off the main thread
By the time the table view sees a row model, the expensive work is already done. The cell should not need to wonder how to turn bytes into text or whether a frame is interesting. It should just paint the answer.
The row model now comes prepared:
struct CANFrame: Identifiable, Equatable, Sendable {
    let formattedId: String
    let visibleDataText: String
    let asciiPreviewText: String
    let shortTimestamp: String

    init(index: Int, timestamp: UInt64, canId: UInt32, extended: Bool, dlc: UInt8, data: [UInt8]) {
        self.formattedId = extended ? String(format: "%08X", canId) : String(format: "%03X", canId)
        self.visibleDataText = data.prefix(8).map { String(format: "%02X", $0) }.joined(separator: " ")
        self.asciiPreviewText = String(data.prefix(8).map { $0 >= 0x20 && $0 < 0x7F ? Character(UnicodeScalar($0)) : "." }.prefix(8))
        self.shortTimestamp = String(format: "%.3f", Double(timestamp) / 1_000_000.0)
    }
}
Again, none of this is rocket science. It’s just discipline.
Modern hardware does not save wasteful UI code
It’s tempting to believe that an A-series iPhone chip should brute-force its way through anything. And indeed, modern devices hide a multitude of sins. But they do not repeal the laws of software physics. If you ask the framework to solve constraints, diff view trees, measure text repeatedly, allocate too many subviews, and do too much work during rapid updates, you will still pay for it.
The key lesson here is that UI performance is not usually lost in one dramatic mistake. It leaks away in death by a thousand abstractions. Each one seems harmless. Together they turn “should feel instant” into “why is this slightly sticky?”
And when you strip those abstractions away, the result can be almost embarrassingly better.
Conclusion
Don’t get me wrong, I still like SwiftUI and I’ll continue to use it for many parts of my iOS apps — the productivity gains are real. But for high-frequency, very large, log-style interfaces on the iPhone, I’m now more convinced than ever that going back to UIKit is only half the way. The major step towards truly fluid scrolling is to keep UIKit on a very short leash: reuse cells, avoid Auto Layout in the hot path, measure once, and draw by hand.
Apparently, even in 2026, the old tricks are still the fast ones. Then again, that shouldn’t come as a surprise to anyone who has ever fought a GUI toolkit for every single frame… I benchmarked framebuffer vs. X11 on a 266 MHz phone back in 2007 and asked whether we really need all those abstractions. Apparently the question is timeless.
Anyway, if you know an even faster way, I’m all ears. Stay tuned for CANcorder :)
From Lektor to Zola — migrating 26 years of content
This website has been running on Lektor, a Python-based static site generator created by Armin Ronacher (of Flask fame), since I moved away from WordPress back in 2019. Lektor served me well: its file-based content model, Jinja2 templates, and simple admin UI were a good fit for a personal site that doesn’t need a database.
But over the past year, the cracks became impossible to ignore.
Why leave Lektor?
Lektor is effectively on life support. The project’s own developers describe it as being in maintenance mode. The two remaining part-time maintainers can barely keep up with dependency rot, let alone ship new features. Version 3.4 has been stuck in beta for over three years — and it contains the fixes for the pkg_resources deprecation warnings that have been plaguing every build since Python 3.12.
Every time I ran lektor build, I was greeted by a wall of deprecation warnings from werkzeug, setuptools, and mistune. *sigh* The plugin ecosystem is stagnant, community activity is near zero (~4,600 PyPI downloads/month), and the next Python or setuptools release could break the build with nobody upstream to fix it. I’d rather migrate on my own terms than be forced to do it in a hurry.
Why Zola?
I evaluated Hugo, Eleventy, Astro, and Zola. The deciding factor was template compatibility: Zola uses Tera, a Rust-based template engine whose syntax is nearly identical to Jinja2. That meant I could port my templates with minimal rewriting rather than learning Go’s template language (Hugo) or switching to JSX (Astro).
Other things I like about Zola:
- Single binary, no runtime dependencies.
brew install zolaand you’re done — no Python virtualenvs, no npm, and no Ruby gems either. - Fast. My 279-page site builds in under 800ms. Lektor took several seconds.
- Built-in Sass compilation, syntax highlighting, feeds, and sitemaps. No plugins needed for the basics.
- Smart punctuation. Zola can automatically convert straight quotes and triple dots to their typographic equivalents — a feature dear to my typographer’s heart (see my XeTeX excursion from 2009, if you don’t believe me).
It hurts a bit to abandon Python here — my “unstoppable love for Python” was the very reason I chose Lektor in the first place — but a single binary that just works beats a virtualenv that needs babysitting. Then again, Python still did the actual migration work, see below :)
The migration
The actual work broke down into a few steps:
Templates. Tera is close enough to Jinja2 that most of my templates needed only minor adjustments. The main gotcha: Tera doesn’t support nested array literals in {% for %} loops, so I had to unroll my navigation loop into explicit <li> elements. A fair trade for the performance gain.
Content. I wrote a Python script that converts Lektor’s .lr format (field-based with --- separators) to Markdown with TOML frontmatter (+++ delimiters). 266 blog posts, plus all section pages, migrated automatically. One subtlety: Lektor allows multiple single-line fields in the same block without separators — the parser needed to handle that.
CommonMark differences. Lektor’s Markdown renderer was more lenient about mixing HTML and Markdown on adjacent lines. In CommonMark (which Zola uses), an <img> tag starts an HTML block that swallows everything until a blank line. I had to insert blank lines after every <img> that was followed by a Markdown heading — about 15 instances across the code, music, and words sections.
Typography audit. While migrating, I scanned all 266 posts for typographic issues. A script replaced 253 instances of ASCII triple dots with proper ellipsis characters (…). The older posts — some dating back to 1999, when yours truly was still blogging in german — had accumulated quite a bit of cruft.
Link audit. I checked all 865 external links. About 200 domains are dead, mostly from the OpenMoko/embedded Linux era (2006–2011). Domains like openmoko.org, trolltech.com, and code.google.com/soc are gone (tempus fugit…). These are historical blog posts, so I’m leaving them as-is rather than littering them with Wayback Machine URLs.
Deploy. The old Lektor deploy used lektor build && lektor deploy (which called rsync internally). The new deploy is simply zola build followed by a direct rsync to the server. The CANcorder manifest generation and version injection pipeline carried over unchanged.
Result
Same content, same URLs, same visual identity — but a build system that will actually survive the next Python release. And builds that finish before I can reach for my coffee :)
If you spot anything that broke during the migration (missing images, broken links, bogus formatting), please drop me a line.
Cheers, :M:
A small Linux toolbox for CAN work
For the last couple of months I have been spending more time on the Linux side of my automotive setup again. Back in 2017 I wrote that I’d love to work on Linux-based infrastructure again — well, it took a while, and it’s CAN buses instead of phones, but here we are. CANcorder is still the place where I want to look at traffic, decode transport protocols, and make sense of what an ECU is doing. But the unglamorous bench work around it still happens on Linux: bring the interface up, switch bitrates, generate load, watch for bus-off, capture a logfile, bridge SocketCAN into the rest of the tooling.
And as usual, the annoying part wasn’t that Linux couldn’t do it. Linux has excellent CAN support. SocketCAN is one of those subsystems that still feels refreshingly direct: open a socket, bind it to can0, read and write frames. The annoying part was that my daily workflow kept decomposing into little piles of shell incantations, Python scripts, ip link commands, candump, cangen, and one-off helpers that were never quite the shape I wanted.
So I cleaned that up.
The result is three small tools:
mcangen, a high-performance CAN frame generator.mcandump, a SocketCAN logger and CANcorder proxy.canconf, a trio of tiny tools:canconf(configure interfaces),canmon(passively monitor health), andcantalk(an interactive REPL for talking to ECUs).
None of them are big frameworks — that’s the point. They are the kind of tools I want to have installed on every Linux machine that might ever see a USB-CAN adapter.
The problem with “just use can-utils”
Now, can-utils is great. I still use it and I’m glad it exists. candump, cansend, cangen, isotpsend, isotprecv — these are the tools that made SocketCAN approachable in the first place.
But once you start building your own diagnostic hardware and software around the bus, the gaps become more visible.
Sometimes I don’t want “send random frames until I press Ctrl-C”. I want exactly one million frames, at a reproducible seed, with a sequence number in the payload, so I can prove where drops happened. Sometimes I want mixed standard and extended identifiers in the same run. Sometimes I want to simulate an ECU flashing session, with ISO-TP bursts, security access, pending responses, DTC handling, resets, and the kind of uneven traffic shape that stresses real tools.
And sometimes I want the generator to stop pretending everything is fine when the CAN controller goes bus-off. *sigh*
Anyway, that was the itch behind mcangen.
mcangen
mcangen is essentially my version of cangen, written in Rust and tuned for the things I keep testing:
mcangen can0 -r 0 -n 1000000 --data-mode sequenceThat sends exactly one million frames as fast as the interface can take them, with an incrementing 64-bit sequence number in the payload. On the receiving side, any gap is a real event: a dropped frame, a lost TCP packet in a bridge, an overloaded logger, a firmware buffer problem, or whatever else is hiding in the path.
For maximum-rate mode, mcangen batches writes with sendmmsg(). For rate-limited mode it uses clock_nanosleep() for the coarse wait and a short busy-spin at the end, which is one of those slightly ugly but effective tricks that makes timing much less sloppy than a plain thread::sleep().
The other important mode is more domain-specific:
mcangen vcan0 --uds-flash -n 1That generates a complete UDS-style reprogramming session. Not just “some frames that look vaguely diagnostic”, but a session with tester and ECU arbitration IDs, diagnostic session control, ECU identification reads, security access, erase, multi-frame firmware transfer, DTC read/clear/verify, ECU reset, and optional OBD-II polling between sessions.
This is useful because UI and logger bugs often do not show up under uniform random traffic. They show up when the traffic has phases: slow setup, sudden bursts, long ISO-TP transfers, pauses, negative responses, resets, and then normal polling again. Real cars do not produce benchmark-shaped traffic.
There is also a quality-test payload mode for CANcorder: fixed ID, magic marker, sequence number, timestamp offset, test ID, checksum. Dull, deterministic, easy to validate. Exactly what a quality test should be.
The bus-off lesson
One surprisingly important part of mcangen is what it does when the controller goes bus-off.
The obvious version of a CAN generator counts successful write() calls. That’s not good enough. A SocketCAN interface can be administratively up while the controller is bus-off. In that state, a generator can happily keep counting frames that never reach the wire. If you are testing loss detection, that is worse than a crash, because it gives you a clean-looking lie.
mcangen opens a second raw CAN socket with an error-frame filter and watches for CAN_ERR_BUSOFF and CAN_ERR_RESTARTED. When bus-off happens, transmission pauses. With --auto-restart, it can cycle the interface via netlink for adapters whose drivers do not implement the normal restart path. That matters for the cheap and common devices, not just the nice lab gear.
This is the kind of detail that doesn’t look exciting in a README, but saves hours on the bench — believe me.
mcandump
The second tool is mcandump.
At first glance it looks like another candump clone:
mcandump can0It reads CAN and CAN-FD frames from a SocketCAN interface and prints them on the terminal with timestamps, IDs, data bytes, and ASCII. It can also write a candump-compatible logfile:
mcandump can0 --log-fileBut the real reason it exists is that it is also a CANcorder logger proxy. It publishes itself via Zeroconf as an ECUconnect logger, accepts TCP clients, and forwards each frame in the binary logger protocol that CANcorder understands.
That gives me a nice split:
- Linux owns the hardware-facing SocketCAN side.
- CANcorder owns inspection, filtering, ISO-TP reconstruction, and the nicer UI on macOS or iPad.
The architecture is intentionally conservative. The CAN reader thread only reads frames and pushes them into channels. TCP clients get dedicated writer threads and their own queues, so a slow iPad on Wi-Fi does not block the raw CAN socket. Log writing runs in another thread. Terminal output runs at lower priority. The hot path is allowed to be boring.
mcandump also asks the kernel for hardware receive timestamps when available, falls back to software timestamps when not, and only falls back to userspace time as the last resort. For many diagnostic tasks that distinction is irrelevant. For latency and ordering work, it is not.
The interactive mode grew out of exactly the same irritation:
mcandump can0 --interactiveIt gives me scrollback, search by byte sequence, search by arbitration ID, and a live tail pane when I scroll away from the newest frames. Again, nothing revolutionary. Just the stuff I kept wanting while staring at a terminal full of hex.
canconf, canmon, and cantalk
The third piece is the least glamorous one, and perhaps the one I use the most. It is a single repo with three commands that sit at three different layers of the daily bench routine: configuring the interface, watching it, and talking to whatever is on the other end of it.
canconf
Configuring SocketCAN interfaces by hand is not hard, but it is tedious enough to invite mistakes:
sudo ip link set can0 down
sudo ip link set can1 down
sudo ip link set can0 type can bitrate 500000 dbitrate 2000000 sample-point 0.875 dsample-point 0.75 fd on
sudo ip link set can1 type can bitrate 500000 dbitrate 2000000 sample-point 0.875 dsample-point 0.75 fd on
sudo ip link set can0 txqueuelen 10000
sudo ip link set can1 txqueuelen 10000
sudo ip link set can0 up
sudo ip link set can1 up
I don’t want that in my shell history twenty times a day. I want this:
canconf 500k/2M@0.875/0.75canconf discovers CAN interfaces by ARPHRD type rather than by name, so it works with can0, vcan0, slcan0, and whatever naming policy the host happens to use. It can bring every interface down, bring them back up, set classic CAN or CAN-FD parameters, set txqueuelen, enable restart timers, enable listen-only mode, and then print what the kernel actually accepted.
The last part matters because CAN bitrates aren’t abstract numbers, they’re derived from controller clocks and timing constants. Drivers round. Hardware differs. canconf bitrates reads the kernel’s reported bittiming_const and tells me what the interface can actually do, including whether CAN-FD data rates are supported.
canmon
canmon is the passive sibling:
canmonIt prints the current state once, then stays silent until something changes: state transition, configuration change, restart counter, or a burst of controller bit errors. That silence is deliberate. If a monitor prints constantly, I stop seeing it. If it only speaks when the bus changes state, I notice.
A typical session that catches a bus going sideways during a flash looks like this:
    TIME  IFACE   STATE           BITRATE      Δerr/s  Δbus/s  restarts  notes
12:04:31  can0    ERROR-ACTIVE    500k              0       0         0  initial · sp 0.875 · qlen 10000 · drv gs_usb
12:05:02  can0    ERROR-ACTIVE    500k/2M           0       0         0  CONFIG 500k → 500k/2M
12:07:18  can0    ERROR-WARNING   500k/2M           0      47         0  STATE ERROR-ACTIVE → ERROR-WARNING · BIT-ERRORS 47/s > 1/s
12:07:19  can0    ERROR-PASSIVE   500k/2M           0     128         0  STATE ERROR-WARNING → ERROR-PASSIVE · BIT-ERRORS 128/s > 1/s
12:07:20  can0    BUS-OFF         500k/2M          12     203         0  STATE ERROR-PASSIVE → BUS-OFF · BIT-ERRORS 203/s > 1/s
12:07:21  can0    ERROR-ACTIVE    500k/2M           0       0         1  STATE BUS-OFF → ERROR-ACTIVE · RESTART #1
Six lines for an entire afternoon of bench work. The first row is the initial snapshot. The second is a reconfiguration when I switched from classic CAN to CAN-FD. Then nothing for two minutes — exactly the silence I want — until the bus starts complaining. The controller crosses error-warning, slides into error-passive, hits bus-off, and the kernel auto-restart driven by canconf … -r 100 brings it back to error-active a tick later. In a real terminal each STATE and BUS-OFF token is coloured by severity, so the bad rows jump out without having to read them.
During flashing work, the column I care about most is not usually packet-level RX/TX errors. It is the controller’s bus-error counter (Δbus/s above). A sudden rise there says “look at the physical bus” much more loudly than another decoded diagnostic response ever could.
cantalk
The third command in the repo is cantalk. I added it once I noticed how often I was opening two terminals — one for isotpsend, one for isotprecv — just to send a single UDS request and look at the response. That dance adds up over a debug session, and it gets in the way of the kind of quick “poke an ECU and see what it says” interaction that a diagnostic shell should make trivial.
cantalk is a tiny interactive REPL. You give it an interface, set an arbitration pair, type hex, see the reply:
❯ cantalk can0
❯ :7E0
❯ 22 F1 90
← 7E8  62 F1 90 57 56 57 5A 5A 5A 31 4B 5A 31 47 30 30 30 30 30 31
        ->  b..WVWZZZ1KZ1G000001
By default it uses the in-tree can-isotp kernel module (mainline since 5.10), so the kernel handles segmentation, flow control, and reassembly. You only ever see complete messages, even when the response is a multi-frame block. For ECUs that do not speak ISO-TP, or when I just want to peek at raw frames, --raw switches to a bare AF_CAN socket and collects every matching frame within a 250 ms quiet window.
The arbitration pair is the part that used to annoy me most. Diagnostic addresses come in pairs — tester request, ECU response — that are easy to swap by accident. cantalk accepts a single TX and auto-derives RX with the conventions everyone uses anyway: TX+8 for 11-bit IDs, J1939-style source/target swap for 18DA<target><source> 29-bit IDs. The last pair used on each interface is persisted to $XDG_STATE_HOME/cantalk/state.json, so next time cantalk can0 starts with the same TX/RX you ended with.
On a TTY the prompt is anchored to the bottom of the terminal in a fixed three-line frame, with the request/response log scrolling independently above it. That sounds gimmicky until you have used a diagnostic shell where the prompt keeps disappearing every time a response arrives. The interaction model deliberately mirrors the term REPL in Swift-CANyonero, which is what CANcorder uses on macOS — same muscle memory across both sides of my workflow. Pipe stdin or pass --plain for a one-prompt-per-line mode when scripting.
The interface has to be up before you start — that’s canconf’s job.
Why three tools?
I could have built one big canlab command with subcommands. I considered it for about five minutes and then decided against it — my aversion to kitchen-sink frameworks ;)
These tools sit at different layers:
canconfconfigures the interface.canmonwatches the health of the interface.cantalktalks to a single ECU interactively.mcangeninjects traffic.mcandumpcaptures traffic and forwards it to CANcorder.
Keeping them separate makes them easier to combine with the rest of the Linux ecosystem. I can run canmon in one terminal, mcandump in another, and start or stop mcangen from a test script. I can use canconf without caring whether CANcorder is even installed. I can pipe logs into existing tools. The boundaries are boring, which is usually a good sign for command-line software.
The workflow
A typical bench session now looks like this:
canconf 500k/2M@0.875/0.75 --berr -r 100
canmon
mcandump can0 --log-file
mcangen can0 --uds-flash -n 3 --speed 2.0
CANcorder discovers mcandump automatically, I get a logfile on disk, canmon tells me if the controller gets unhappy, and mcangen gives me repeatable traffic that looks enough like real diagnostic work to trigger the same classes of bugs.
This isn’t a grand new architecture, it’s more like sharpening the tools around an existing one. CANcorder is the visible part, but the Linux side is where the wire meets the machine, and I want that side to be just as deliberate.
What I like about this little toolbox is that it removes friction: no more remembering ip link syntax, no more wondering whether the generator actually sent what it claims, no more guessing whether the logger or the UI dropped a frame, and no more staring at a silent bus-off controller while a test keeps “passing”.
Automotive diagnostics already has enough uncertainty, the plumbing shouldn’t add more. All three tools are on GitHub — if you’re doing CAN work on Linux, give them a try and let me know what’s missing. Stay tuned for more :)
ELMterm, CornucopiaStreams, and the joy of clean automotive telemetry
Back in 2016 I fell deep into the rabbit hole of automotive diagnostics (long-time readers may remember OBD2 Expert). What started as “let me decode one CAN frame” quickly became a multi-year tour of every adapter I could get my hands on: ELM327 clones, genuine STN units, Bluetooth dongles, USB-serial cables, Wi-Fi gateways, even a few early BLE UART experiments. Every single one of them promised to be the answer, and every single one of them let me down in its own special way: flaky transports, unreadable hex dumps, and notebooks full of copy-pasted traces. *sigh* Eventually I built my own hardware so I could at least trust the bits on the wire, but I still lacked a terminal that respected the data I was seeing. Anyway, that’s why ELMterm exists.
Why another terminal?
Classic tooling (nc, telnet, minicom, picocom, …) treats adapters like anonymous byte pipes. That’s fine for a quick sanity check, but terrible when you’re juggling OBD-II, UDS, ISO-TP, and vendor quirks day in, day out. ELMterm knows the automotive domain: it annotates AT/ST commands, explains diagnostic modes, reassembles ISO-TP bursts, and highlights negative responses, ASCII payloads, and VIN frames automatically. It’s my way of keeping the conversation with the car readable, whether I’m validating my own adapter firmware or reverse-engineering a random aftermarket device.
Powered by CornucopiaStreams
The other half of the story is CornucopiaStreams, my transport abstraction that grew out of those same diagnostic sessions. After testing dozens of adapters I wanted one code path for every physical link. CornucopiaStreams is that “horn of plenty” (yes, I couldn’t resist the latin name): point it at a tty://, tcp://, ble://, ea://, or rfcomm:// URL and it hands back a matched Input/OutputStream pair. Serial over USB, Wi-Fi bridges, BLE UARTs, even MFi External Accessories all look identical to ELMterm. That means I can swap transport layers in seconds — one moment I’m on a USB cable in the lab, the next I’m walking around the car with a BLE prototype — without changing a line of REPL logic.
Where to get ELMterm
ELMterm lives on GitHub under the Automotive-Swift org:
- Repository: https://github.com/Automotive-Swift/ELMterm
- License: MIT
- Requirements: Swift 6.2+, macOS 13+, Xcode command line tools.
Clone it and build the release target:
git clone https://github.com/Automotive-Swift/ELMterm.git
cd ELMterm
swift build -c release
The binary will appear at .build/release/ELMterm. Because it’s a SwiftPM project you can also swift run ELMterm … while iterating.
How I use it day to day
Pick any adapter URL that CornucopiaStreams understands and pass it to ELMterm:
## USB serial, common bitrate
tty_url="tty://adapter:115200/dev/cu.usbserial-ELM"
ELMterm "$tty_url"

## Wi-Fi bridge
tcp_url="tcp://192.168.0.10:35000"
ELMterm "$tcp_url"

## BLE prototype (service FFF0)
ble_url="ble://FFF0"
ELMterm "$ble_url"
Once connected you get a readline-style prompt (configurable via --prompt) with command history that persists to ~/.elmterm.history by default. I tend to keep timestamps on (--timestamps) when validating long bench sessions, and the new theming support lets me switch between a light palette (perfect for my yellow terminal) and a dark palette for late-night hacking (--theme light|dark).
A few other flags I reach for:
--terminator crlfto match adapters that expect both CR and LF.--hexdumpwhen I suspect malformed frames and want ASCII + hex simultaneously.--plainto disable annotations when I’m profiling raw throughput.--config ~/.elmterm.jsonso field gear inherits the same defaults without more CLI typing.
Inside the REPL there are helper commands (:history, :clear, :analyzer on|off, :save, :quit) so I rarely leave the keyboard while probing.
What’s next?
ELMterm and CornucopiaStreams continue to evolve together. Every time I touch a new transport — say, BLE L2CAP with a custom ECU, or a TCP bridge baked into a logger — I add the capability to CornucopiaStreams and immediately reap the benefit in ELMterm. Likewise, improvements in the analyzer (better ISO-TP handling, rich metadata, smarter VIN extraction) go straight into my daily workflow. Building my own adapter took away the “can I trust the hardware?” question; ELMterm takes away the “can I trust my tooling?” question. What’s left is “can I trust the ECU?” — and believe me, you can’t ;)
If you work on OBD-II/UDS diagnostics, or you simply want a terminal that actually understands what your automotive adapter is telling you, give ELMterm a try. Clone it, point it at your favorite transport, and let me know what’s missing — I’m sure there’s plenty.
Cheers, :M:
RetroPlayer – Bringing the Sound of My Youth to iOS
True readers of this column know how much I adore the C64 sound aesthetics — I’ve been going on about it in previous installments more than once. So here’s the next chapter of that story.
Growing up in the 1980s, I spent countless hours in front of a Commodore 64, and later an Amiga, absolutely mesmerized by what these machines could do. The graphics were captivating, the games were endlessly replayable, but what truly captured my imagination was the sound. The SID chip in the C64 — with its distinctive three voices — could produce music that seemed impossible for such simple hardware. Composers like Martin Galway, Rob Hubbard, and Ben Daglish squeezed basslines and melodies out of a chip that was never meant to be a musical instrument — and they did it in a couple of kilobytes.
The Amiga took this even further. Paula’s four-channel PCM audio opened up a whole new world of sample-based music. The demoscene exploded (me included, see my AMIGA page), and suddenly you had MOD files — tracker music that felt like the future. Each machine had its own sonic fingerprint, its own limitations that somehow became strengths in the hands of talented composers.
Full Circle
Fast forward to 2008. The iPhone SDK had just been released and I was itching to build something for this new platform. What did I choose for my very first iOS app? A SID player, of course :) Some years later Apple kicked it (and its siblings Module Player and Pokey Player) out of the store for “downloading executable code” — a story I told back in 2015 — but the itch never went away.
Now, seventeen years later, I’ve come full circle with RetroPlayer. But this time, it’s not just the C64. RetroPlayer brings together the iconic sound chips from all the machines that defined that golden era: the Commodore 64’s SID, the Amiga’s Paula, the Atari XL’s POKEY, and the Atari ST’s Yamaha YM2149.
What RetroPlayer Does
RetroPlayer is what Sid Player should have become ten years ago. It’s built natively for iOS, macOS, and even visionOS, using modern SwiftUI while paying homage to the aesthetics of those vintage machines. Each platform has its own visual identity — period-authentic imagery and brand gradients that evoke the original hardware.
The app taps into the incredible work of preservation communities like HVSC (High Voltage SID Collection), ASMA (Atari SAP Music Archive), SC68, and MODLAND, giving you access to thousands of authentic chiptunes. You can browse curated playlists like the HVSC Top 100 — the most beloved C64 tracks of all time — or dive into the complete works of legendary composers.
But my favorite feature? The real-time oscilloscope visualization — the spiritual successor of the OpenGL oscillator view I bragged about in 2010. Watch the audio waveforms dance across your screen with phosphor-trail effects that evoke vintage CRT monitors. It’s both a visual treat and a window into the raw audio synthesis happening beneath the surface — the same waveforms that fascinated me as a kid, now rendered in real time on modern hardware. (Back in 2007 I was thrilled that a 266 MHz ARM phone could emulate a SID at 10% CPU load. Some things never get old.)
A Modern SID Player for macOS
While RetroPlayer works beautifully on iOS, iPadOS, and visionOS, I also built a full-featured macOS desktop version. If you’ve been following the SID player scene on Mac, you might know that SIDPLAY hasn’t been updated since 2016. RetroPlayer fills that gap with a native Apple Silicon app that brings the same curated playlists, real-time visualization, and extensive music catalog to your Mac.
Why bother?
Don’t let anyone tell you these are just bleeps and bloops. This is music written under constraints that would make any modern producer cry — and it has inspired generations of electronic musicians, yours truly included.
RetroPlayer includes full playback features: background audio, system media controls, lock screen metadata, favorites management, and powerful search across the entire catalog. It even supports CarPlay, so you can take Wizball, Last Ninja, or Sanxion with you on the road.
Full circle, for real this time
I must confess that building RetroPlayer has been a lot more personal than the usual client work — 17 years after the first Sid Player — and a decade after I first announced it here — I finally got to do this properly. (The crowdfunding campaign I promised in 2015 never happened, by the way. Turns out I’d rather write code than pitch decks ;)) If you grew up with these machines, you know why. If you didn’t… well, you’re in for a treat.
RetroPlayer is available on the App Store. Let me know what you think — and stay tuned, this is just the beginning :)
Do old-style version numbers still make sense?
Long before the endless scroll of release notes and automatic updates, software came packaged in physical media: floppies, CDs, DVDs. Version numbers were lovingly crafted — Version 3.5.2 meant something (at least to those of us who still remember writing it on a floppy label ;)). It signaled a hierarchy: major features, minor improvements, bug fixes. You knew exactly what you had.
Back then, if you were shipping a desktop app on CD, you couldn’t just push a micro-patch. You needed a build, a test cycle, a labeled release (Sid Player 1.2.49, anyone?). A three-part version number made sense: major.minor.patch told a coherent story.
Then came broadband, app stores, Docker containers, continuous deployment pipelines — and everything changed. Today, software updates roll out automatically, sometimes multiple times per day. Does 3.5.2 still mean much in a sea of nightly builds and daily hot-fixes?
Let me compare the old and the new world:
Hand-crafted version numbers (e.g. 2.4.7)
Pros:
- Convey structured meaning: major changes vs bug fixes.
- Easy to reference in support, documentation, or bug reports.
- Feels final, stable, versioned. Good for releases on solid media.
Cons:
- Arbitrariness in deciding what merits a version bump.
- Bottleneck: a human must decide to increment.
- Misleading in fast-update contexts: “Oh, version 2.4.8? Is it worth updating today?”
Date-based version numbers (e.g. 2025.06.20)
Pros:
- Clear timestamp: exactly when it was released.
- Scales effortlessly: daily, hourly, on-the-fly.
- Avoids ambiguity over “minor” vs “patch” — every build is traceable.
Cons:
- No structural hierarchy: can’t tell at a glance if it’s a major feature or a tiny fix.
- Slightly more verbose.
- Feels less “semantic” — you can’t infer scope from the version itself.
A possible compromise
What if we combine both? Let me propose a concatenation of major version and date, e.g. 5 – 2025.06.20.
(By the way, Apple just jumped from iOS 18 to iOS 26 — which is really nothing but the year in disguise. I’m not saying Cupertino reads this blog… ;))
Pros:
- MajorVersion indicates broad, breaking, feature-set changes.
- Date signals exactly when you shipped it.
- Updates during the same day can have additional prefixes, if necessary.
- A major bump (say,
6 – …) only happens on real, feature-heavy releases.
Cons:
- Slightly more verbose.
Why do I think this works? Because you immediately know: “Yep, still version 5, same major features as earlier builds, but built on June 20, 2025.”
It’s also flexible: keep shipping bug fixes or minor features even daily — no need to agonize over whether it’s 5.0.1 or 5.1.0 (and no more heated discussions about it either). Last but not least, it’s old-school meets modern: you keep the stability of “version 5” and gain the transparency of “built on 2025-06-20”.
Conclusion
We’ve moved from floppy-based releases, where version numbers were carefully picked, to a world of ubiquitous, atomic updates. Back then, structured numbering made sense; today, timestamps are king. But we don’t have to choose — a major-version + build-date scheme gives us both.
Whether you distribute on physical media or via container orchestrators, you get:
- Semantic hierarchy, from major version.
- Precise timing, from date-based builds.
- Simplicity, avoiding patch/minor version anxiety.
Now that software never really ends, maybe it’s time we let version numbers reflect what changed and when – without overthinking the number of dots.
Anyway, that’s my two cents. If you have strong opinions about SemVer (and who hasn’t?), I’m all ears.